Overview of Data Contours
The primary means of data interpretation after a RS2 analysis, is the viewing of data contours directly on the model.
Sigma 3 contours around excavation
The RS2 Interpret program allows you to display contoured data from the finite element analysis, by selecting a data type from the drop-down list in the toolbar. By default, when a file is opened (or when a new window is opened for an already open file), Sigma 1 contours will be displayed on the model.
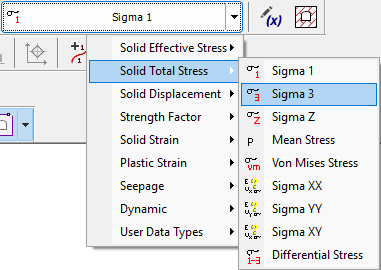
To view contours of other data, use the mouse to select the desired data from the drop-list.
Basic Data
The following data types will always be available for contouring after a RS2 stress analysis:
- Principal Stress - Sigma 1, Sigma 3, Sigma Z, Mean Stress, Deviatoric Stress
- Displacement - Horizontal, Vertical, Total
- Strength Factor
- Strain - Volumetric, Maximum Shear
In addition to the basic data, other data types may appear in the drop-down list in the toolbar, as described below.
Yielded Elements
If any of the materials used in the analysis have been defined as having Plastic material properties, then Yielded Elements can be contoured on the model. See the Yielded Element Contours topic, for a description of how this contouring is achieved.
Effective Stress Analysis
If pore pressure has been included in the analysis (e.g. Piezometric lines, a water pressure grid or a finite element seepage analysis), then effective stress data and pore pressure will be available in the toolbar list:
- Effective Sigma 1
- Effective Sigma 3
- Effective Sigma Z
- Pore Pressure
Groundwater Seepage Analysis Data
If you have computed a groundwater seepage analysis (i.e. Groundwater Method = Finite Element Analysis in Project Settings), then you may contour the following results of the analysis:
- Pressure Head
- Total Head
- Discharge Velocity
- Hydraulic Gradient
- Permeability
If a spatial distribution function is used for the parameter, the corresponding contour from the list below will be available. All contours are generated through function interpolation, with exceptions for certain Permeability Models as noted (i.e., Constant and User Defined models).
- Permeability Spatial Distribution
- User Defined model: value interpolated from the Relative Ks function * first value (assumed as the saturated permeability by RS2) from User Defined – Permeability function
- WC Spatial Distribution
- Constant: wc = degree of saturation * porosity = 1*porosity
- User defined: value interpolated from the Relative WC function* first value (assumed as the saturated WC by RS2) from User Defined – WC function
- Residual WC Spatial Distribution
- Constant: wc = degree of saturation * porosity = 1*porosity
- User defined: value interpolated from the Relative WC function* last value (assumed as the residual WC by RS2) from User Defined – WC function
- K2/K1 Spatial Distribution
- K1 Angle Spatial Distribution
Thermal Analysis Data
If you have included a thermal analysis in your model (i.e., enabled Thermal Analysis option in Project Settings dialog), then you may contour the following results of the analysis under Thermal data contour category:
- Temperature
- Horizontal Flux
- Vertical Flux
- Total Flux
- Horizontal Gradient
- Vertical Gradient
- Total Gradient
- Horizontal Conductivity
- Vertical Conductivity
- Total Conductivity
- Specific Heat
- Unfrozen Water Content
User Data
With the User Data option, Interpret allows the user to contour almost any data used in the analysis, including user-defined functions of all input or output analysis variables. If User Data has been defined, then the names of these variables will appear at the end of the list of variables available from the drop-down list in the toolbar. See the User Data topic for details.
NOTES:
- If you want to simultaneously view more than one data type for a single file (e.g. Sigma 1 and Sigma 3), then you must select New Window from the Window menu. This will generate a new window with a Sigma 1 contour plot. You can then plot any data you wish in the new window.
- Any number of new windows can be opened for a given file, allowing the user to view different data in different windows, or to view different parts of the model in different windows, for example.
- Selecting a new data option from the toolbar, updates the contour plot in the active view only.
- If multiple windows have been opened, the user can select Tile Horizontally or Tile Vertically from the Window menu, to automatically tile the windows within the application window.
- Many options are available in the Contour Options dialog, allowing the user to change the style, range, etc. of the contour plots. The Contour Options operate on a per view basis, so that each view can have its own set of contour options applied.
Auto Update
Data Contours are auto updated in RS2 Interpret. It means that, after a model has been computed, if the model is then modified in RS2 Modeller and re-computed, the new contour results will be automatically updated in the window. See the RS2 Interpret – Auto Update topic for more detail.