Export Query to Excel
The Export Query to Excel option from the Statistics menu allows you to export the material query data to Excel after a Probabilistic Analysis. This option is only available if you have computed a Probabilistic Analysis.
To use the option:
- To enable this option, make sure the model has been computed with a probabilistic analysis.
- First select the data type you would like to view from the drop-list at the top of the screen (e.g. Sigma 1, Total Displacement, Strength Factor etc).
- Add a Material Query that you would like to export data from using Add Material Query, Query Boundary, Query Excavations, or Query Nodes option from the Query menu.
- Select Export Query to Excel from the Statistics menu. A dialog will be prompted.
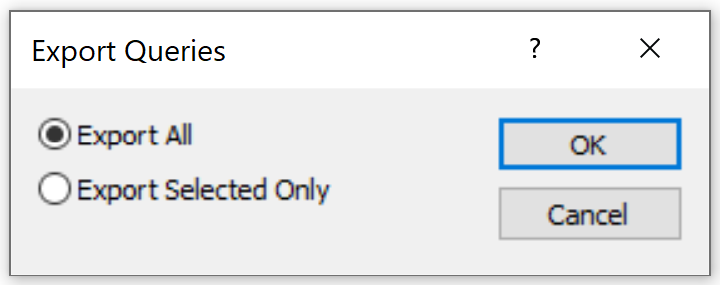
- In the Export Queries dialog, you can choose to export all material queries in the model (Export All), or export a selection of material queries (Export Selected Only). Select OK when complete selection.
- If Export Selected Only is selected, you will be prompted to select the material queries to export.
- You can select individual queries with the left mouse button, or multiple queries with a window. Right-click on the screen for more selection options.
- When completed selection, press Enter or right-click and select Done Selection.
- A Save As dialog will be prompted. Enter the Excel file name and location, and click Save.
The Excel file will be saved and open.
The first tab, “Info”, provides general details, including current stage # relative to total stage #, data type (e.g., sigma 1), and number of component files (e.g., Statistical = 10).
For the Point Estimate Method, it also contains a table of random variables in base and component files. For example, if your model uses two random variables:
Cohesion (Mean = 5, Std.Dev. = 1)
Friction Angle (Mean = 30, Std.Dev. = 3)
The analysis will be computed four times. In addition, RS2 will compute it once more using the mean values of all parameters as the Base File. Five statistical component files will be computed in total.
- The second tab, “Queries”, contains the contour data values of selected query points computed for each statistical component files and the Base file.
See Probabilistic Analysis topic, and Probabilistic Analysis – Show Values page for more information.
Shortcut – Export to Excel
As an alternative to the Export Query to Excel option from the Statistics menu, the Export to Excel shortcut allows quick export for a selected query.
To use this shortcut:
- Create a query (see steps 1-3 above).
- Right-click the query and select Export to Excel from the pop-up menu.
- Save and plot the query in Excel (see step 6 above).