Error Plot
The Error Plot option allows you to plot the mean and standard deviation of data along any material query after a Probabilistic Analysis. The Error Plot option is only available if you have computed a probabilistic analysis.
To generate an error plot:
- First select the data type you would like to view from the drop-list at the top of the screen (e.g. Sigma 1, Total Displacement, Strength Factor etc).
- Select the Error Plot
 option from the toolbar or the Statistics menu.
 - Use the mouse to select a material query. You may only select one query for an error plot.
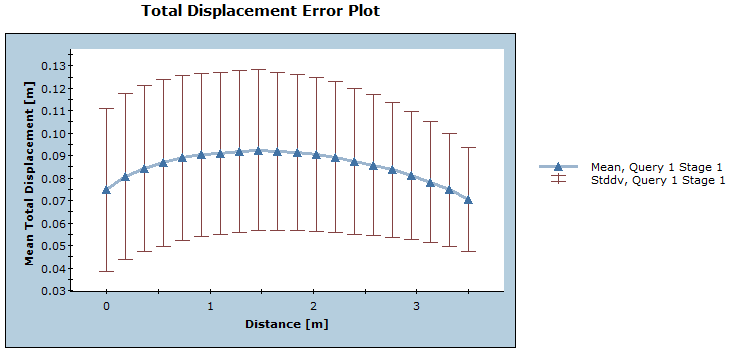
- Press Enter or right-click and select Graph Selected and the error plot will be generated as shown below.
The central curve plots the mean data values along the query, and the height of the vertical bars indicate plus / minus one standard deviation from the mean values.
If you right-click on an error plot there are many options available for customization of the view and exporting data.
Error plot for total displacement along floor of tunnel

Right-Click Shortcut
If you right-click on a material query the Error Plot option is available in the popup menu.