Show Statistical Condition
In RS2 Interpret, the Show Statistical Condition option allows you to display probabilistic analysis results under a chosen statistical condition. The available statistical condition range in RS2 is from three times standard deviation less than mean value (μ-3σ), to three times standard deviation more than mean value (μ+3σ).
By default, the statistical condition is set to mean value.
To show results under a specific statistical condition:
- To enable this option, make sure the files has been computed with a probabilistic analysis.
- Select Show Statistical Condition from the Statistics menu. A dialog will be prompted as below.
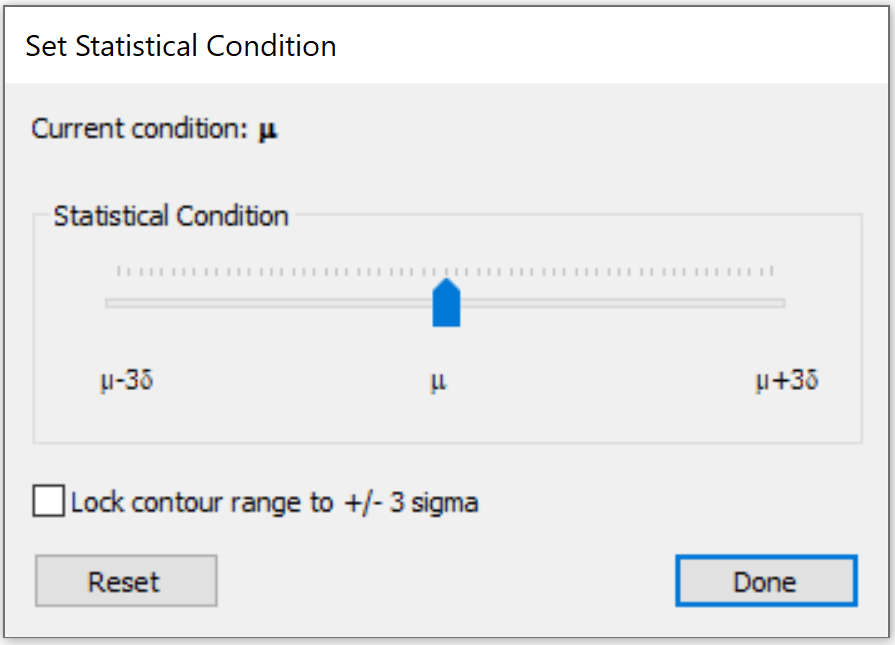
- In the Set Statistical Condition dialog, select the statistical condition to apply to the results.
- You can choose to only display the contour range between μ-3σ and μ+3σ by selecting the checkbox for Lock contour range to +/- 3 sigma.
- Select Reset to go back to mean value. Select Done when completed selection.