RSPile
RSPile
RSPile is your one-stop-shop for comprehensive pile analysis software. Analyze driven pile installation, axially loaded piles, laterally loaded piles, and more. And with deep integration with Slide2, RSPile is the perfect complement to your slope stability analysis.

Applications
RSPile is a general pile analysis software for analyzing driven pile installation, axially loaded piles and laterally loaded piles. It can compute the axial capacity for driven piles as well as the pile internal forces and displacements under various loads and soil displacements. RSPile can also compute pile resistance forces for use in Slide2 for enhanced slope stability analysis.
Software Screenshots


Applications
What’s new in RSPile 2018
RSPile 2018 significantly increases the functionality of the software with the following upgrades:
- Interface improvements: RSPile has been completely redesigned to allow for the modeling of non-horizontal soil layers using borehole data
- All-new Group Pile Analysis option enables quick and easy analysis of pile groups under lateral and axial loads
- The Cap Designer allows users to easily define circular, rectangular, or custom-shaped caps
- Additional lateral and axial soil models with the ability to plot p-y and t-z curves at each depth along the pile, as well as mobilized soil reaction and slope vs. depth
- New Concrete Designer allows for easy design of reinforced concrete and prestressed concrete piles
Lateral Pile Analysis
RSPile includes the following lateral pile analysis capabilities:
- Reinforced concrete piles
- Prestressed concrete piles
- 10 new soil types
- API Method for Sand
- Loess Soil
- Liquified Sand
- Piedmont Residual Soils
- Strong Rock (Vuggy Limestone)
- Modified Stiff Clay without Free Water
- Silt (Cemented C-Phi Soil)
- Soft Clay with User Defined J
- Hybrid Liquified Sand
- Massive Rock
- Plot of p-y curves at each depth
- Plotting of mobilized soil reaction and slope vs. depth
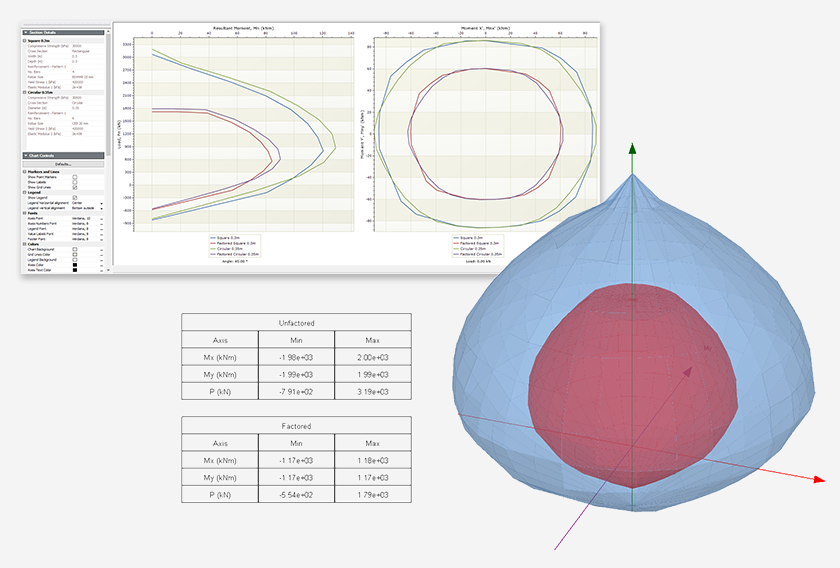
Reinforced and prestressed concrete sections are a major addition to RSPile 2018. A circular or rectangular reinforced or prestressed concrete section with a casing and core can easily be defined using the Concrete Designer.
All standard rebar and strand sizes are available in the Designer and radial, rectangular, and custom reinforcement patterns can be defined. The cross-section display updates automatically as you design your section.
These section types can be used alongside the new LRFD load combinations option in RSPile. Load combinations, from the ACI handbook, will be available as default load combination options and there will also be a user-defined option where any custom load combination can be defined.
RSPile integrates seamlessly with Slide2 2018 for slope stability analyses. The pile resistance functions from RSPile can be imported through an easy-to-use utility in the support properties dialog. For each slip surface intersection with the pile, linear interpolation is used to determine the appropriate resultant pile resistance to compute the factor of safety.
The resistance functions shown on the piles in Slide2 are the resultant forces of the axial and lateral resistance functions at each sliding depth.
Axial and Driven Pile Analysis
Axial Pile Analysis
For axially loaded piles, the load transfer curves are known as t-z curves for soil skin friction and q-z curves for soil end bearing resistance.
There are numerous materials available for axially loaded pile analysis, as well as the ability to print t-z and q-z curves with depth. New materials available in RSPile 2018 are:
- Coyle Reese Clay
- Drilled Clay
- Drilled Sand
- Mosher Sand
Driven Piles
Driven piles are analyzed using similar methods to those in the software Driven by the Federal Highway Administration. Various recommended load transfer curves are available in RSPile and are presented in the RSPile theory manual.
Pile Resistance Analysis
RSPile offers Lateral and Axial Pile Resistance analysis, the results of which can be viewed in their respective Resistance Graphs.
Lateral Resistance Graph
The Lateral Resistance Graph is the lateral resistance against sliding at each sliding depth, where the sliding depth is based on the pile length divided by the Number of Intervals as set by the user. The two options available are: Max Allowable Lateral Displacement Analysis and the Ultimate Lateral Resistance.
Axial Resistance Graph
The Axial Resistance Graph is the axial resistance against sliding at each sliding depth, where the sliding depth is based on the pile length divided by the Number of Intervals as set by the user. The two options available are: Max Allowable Axial Displacement and the Ultimate Axial Resistance.
Integration with Slide2
The compatibility of RSPile with Slide2 is one of its most important features. Pile resistance graphs generated in RSPile can be imported into a support type in Slide2 and used in a slope stability analysis;
- Pile properties are defined in RSPile, which computes the mobilized lateral and/or axial resistance along the length of a pile, for a given soil geometry and loading conditions.
- The pile support force used in the Slide2 analysis is then determined by the location and angle of the slip surface intersection with the pile.