Probabilistic Analysis
In RS2 you can perform a probabilistic analysis to determine the effect of uncertainty or variability of input parameters, on the results of the finite element analysis. To enable probabilistic analysis:
- Select the Statistics page in the Project Settings dialog.
- Select the Probabilistic Analysis check box.
- Choose a sampling method (Point Estimate, Monte Carlo or Latin Hypercube) and enter the Number of Samples if applicable.
- select [OK].
You will now be able to define random variables (material properties, joint properties, field stress) using the options in the Statistics menu. See the Probabilistic Analysis Overview topic for further information. The sampling method options are described below.
Point Estimate Method
The Point Estimate Method is a simplified method of generating random input variables based on Rosenblueth’s point estimate method (Rosenblueth 1972). In this method, two "point estimates" are made for each random variable at fixed values of one standard deviation on either side of the mean (mean + standard deviation, mean - standard deviation). The finite element analysis is carried out for each possible combination of point estimates. This produces 2m solutions, where m is the number of random variables involved.
EXAMPLE
Let's say you wanted to account for the uncertainty in the material strength parameters cohesion and friction angle for a single material.
Number of random variables = 2 (cohesion and friction angle).
Mean value of cohesion = 5 with standard deviation = 1. Point estimates = 4 and 6 (i.e. 5 plus / minus 1)
Mean value of friction angle = 25 with standard deviation = 2. Point estimates = 23 and 27 (i.e. 25 plus / minus 2).
There are four possible combinations of point estimates:
Cohesion | Friction Angle |
4 | 23 |
4 | 27 |
6 | 23 |
6 | 27 |
When you select Compute, the finite element analysis will be computed independently for each possible combination of random variable point estimates. In this example, the finite element analysis would be computed FOUR times (once for each of the four combinations of point estimates for c and phi.) In addition, the RS2 analysis is always computed ONCE using the mean values of all parameters (i.e. the same as a deterministic finite element analysis). So the analysis would be run a total of FIVE times for this case.
In the context of geotechnical finite element analysis, the Rosenblueth point estimate method of probabilistic analysis is suitable for problems involving only a few random variables (e.g. 2 to 6). For larger numbers of random variables (e.g. greater than 10) the computation time and output file storage requirements may become prohibitive. This will depend on the size and nature of the problem being computed. For problems involving more than about 10 random variables, the Monte Carlo or Latin Hypercube methods are recommended.
For additional information regarding the applicability and theoretical background of the point estimate method see the Probabilistic Analysis document in the RS2 theory section.
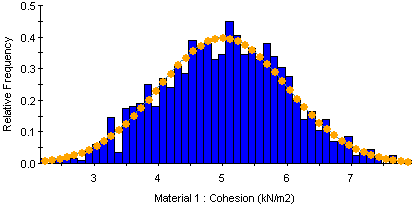
Monte Carlo
The Monte Carlo sampling technique uses random numbers to sample from the input data probability distributions. Monte Carlo techniques are commonly applied to a wide variety of problems involving random behavior in geotechnical engineering.
Monte Carlo sampling of Normal distribution (1000 samples)
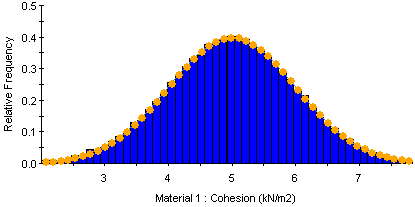
Latin Hypercube
The Latin Hypercube sampling technique gives comparable results to the Monte Carlo technique, but with fewer samples [Iman et.al. (1980), Startzman et.al. (1985)]. The method is based upon "stratified" sampling with random selection within each stratum. This results in a smoother sampling of the probability distributions.
Latin Hypercube sampling of Normal distribution (1000 samples)
Number of Samples
For the Monte Carlo or Latin Hypercube methods you must enter the Number of Samples. This determines the Number of Samples which will be generated for each random variable for the Probabilistic Analysis. For example, if Number of Samples = 1000, then 1000 values of each random variable (for example, Cohesion of Material 1) will be generated, according to the Sampling Method and statistical distribution for each random variable. The analysis will be run 1000 times, creating 1000 sets of results from which the statistical output data is derived.