Graph Time Queries
To graph data for dynamic time query points:
- Select Graph Time Queries
 from the Graph menu.
 - Use the mouse to select time query points. You can select one or more points, and you can select Solid or Liner time query points. When finished selecting press Enter or right-click and select Graph Selected. You will see the Graph Time Query Data dialog.
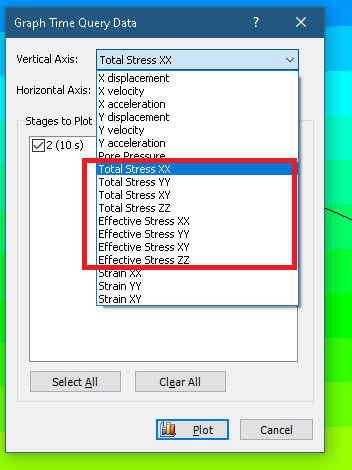
- In the dialog, choose the data you wish to plot on the vertical axis (e.g. X displacement, X velocity) and the horizontal axis. Use the Stages to Plot checkboxes to plot data for the desired stages.
- Select the Plot button and the time query graph will be generated for all selected query points and stages.
NOTE: after a graph is generated, many options are available in the right-click menu or the Chart menu for customizing the graph display, exporting data, etc.
Liner Time Query Points
Note that you can select Solid Time Query points or Liner Time Query points with the Graph Time Queries option. The only difference is that for Liner Time Query points, additional data types will be available for plotting (e.g. Rotational data).
Right Click Shortcut
To graph data for a single time query point, you can right click on a query point and select Graph Time Query Data from the popup menu. This shortcut can only be used to plot data for a single point, to plot data for multiple points on the same graph you must use the Graph Time Queries menu option as described above.
Dynamic history (stress and strain)
Some new data for dynamic history (stress and strain) is available. Here are the example format of the output:
- X-disp
- Y-disp
- X-vel
- Y-vel
- X-acc
- Y-acc
- Rz-disp
- Rz-vel
- Rz -acc
- PP
- SXX
- SYY
- SXY
- SZZ
- EXX
- EYY
- EXY
Stress Plotting for Dynamic Time Query
Stress plotting for Dynamic Time Query is split into:
- Total Stress
- Effective Stress
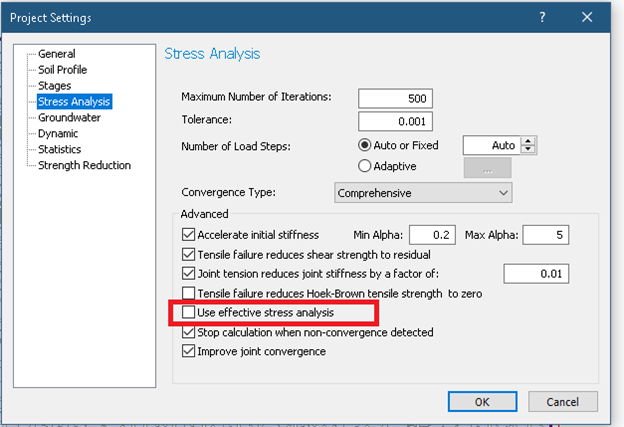
The program computes either Effective or Total stress according to the project settings indicated in the Stress Analysis tab.
CALCULATING TOTAL STRESS
To calculate Total Stress, given Effective Stress:
Total Stress = Effective Stress + Pore Pressure
CALCULATING EFFECTIVE STRESS
To calculate Effective Stress given Total Stress:
Effective Stress = Total Stress - Pore Pressure