Rocscience International Conference 2025 is going to take place in Sydney, Australia Read more

Search Results

Graph Statistical Liner Data

In RS2 Interpret, the Graph Liner Statistical Data option allow you to plot statistical liner data after a probabilistic analysis. This option is only available if you have computed a Probabilistic Analysis with liners.

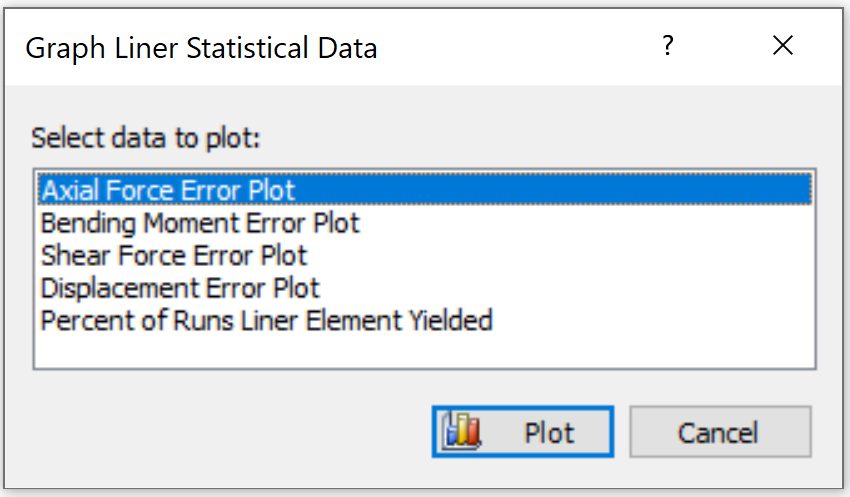
Five types of statistical liner data plots are available in RS2:

  1. Axial Force Error Plot
  2. Bending Moment Error Plot
  3. Shear Force Error Plot
  4. Displacement Error Plot
  5. Percent of Runs Liner Element Yielded

To generate a statistical liner data plot:

  1. To enable this option, make sure the files has been computed with a probabilistic analysis, and liners are modeled.
  2. Select Graph Statistical Liner Data from the Statistics menu. A dialog will be prompted as below.
  3. graph liner statistical data_dlg

  4. In the Graph Liner Statistical Data dialog, select a data type to plot.
  5. Select Plot when complete selection. The graph will be generated and displayed in a new window.
Rocscience logo, click here to return to the homepage Portal Account Portal Account Log In Log Out Home Shopping Cart icon Click here to search our site Click here to close Learning Tech Support Documentation Info Chevron Delete Back to Top View More" Previous Next PDF File Calendar Location Language Fees Video Click here to visit Rocscience's LinkedIn page Click here to visit Rocscience's YouTube page Click here to visit Rocscience's X page Click here to visit Rocscience's Facebook page Click here to visit Rocscience's Instagram page Click here to visit Rocscience's Reddit page Bookmark Network Scroll down for more Checkmark Download Print Back to top Single User Multiple Users RSLog RocFall3 CPillar Dips EX3 RocFall RocPlane RocSlope3 RocSupport RocTopple RS2 RS3 RSData RSPile Settle3 Slide2 Slide3 SWedge UnWedge RocTunnel3 RocSlope2 BlastMetrix ShapeMetriX Fragmenter Commercial License Education License Trial License Shop safe & secure Money-back guarantee