Heat Transfer Section
A Heat Transfer Section in RS2 is a user-defined line segment or polyline, through which the heat flow rate across the line segment(s) will be calculated during a thermal finite element analysis.
- A Heat Transfer Section is created with the Add Heat Transfer Section option in the RS2 Model program.
- Heat Transfer Sections can only be defined if the Thermal Method = Steady State FEA or Transient FEA in Project Settings.
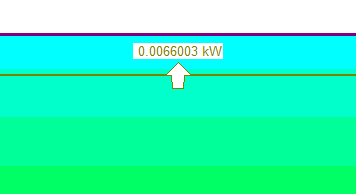
After the analysis has been computed, if any Heat Transfer Sections were defined, the flow rate through the Heat Transfer Section(s) will be displayed in the RS2 Interpret program. An arrow indicates the direction of flow, and the value of the average flow rate is displayed, as shown below. If a heat transfer section is a polyline, RS2 will calculate the flow through each segment of the polyline.
Display of Heat Transfer Sections
A Heat Transfer Section is displayed as a dark green line, with small circles marking the endpoints. An arrow and value indicate the direction and magnitude of flow through each segment.
In the RS2 Interpret program, the display of Heat Transfer Sections can be turned on or off under the thermal tab in the Display Options dialog or with the toolbar shortcut. You can also right-click on a Heat Transfer Section to toggle the visibility of the value.
Graph Heat Transfer Section
To graph heat transfer section data:
- A Heat Transfer Section is created in RS2 model.
- Select Graph Heat Transfer Section option from the Graph menu (proceed to Step 2), or right click on the heat transfer section, and select Graph Heat Transfer option (proceed to Step 3).
- You will first be prompted to pick the heat transfer section(s) to graph. Use your mouse to select desired heat transfer section(s) to plot. Hit Enter to complete selection.
- You will see the Graph Heat Transfer Data
dialog. In the dialog, select data type for the Vertical Axis to plot (see section below). The data will be plotted over Time. Select one or more stage(s) to plot from the Stage to Plot section.
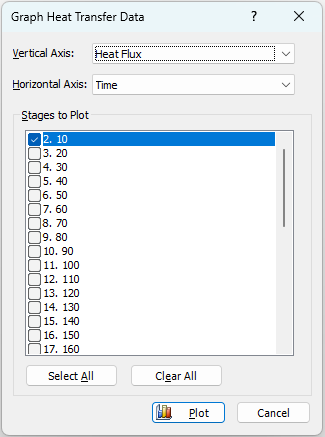
- Select Plot to generate the graph.
Graph Heat Transfer Section Data Type
The available heat transfer section data to be plotted are:
- Heat Flux
- Accumulative Heat Flux
- The sum of total heat flux per time step (from the first stage that heat transfer section was installed) until the current time.