
RSData
Strength & Stress Analysis of Rock and Soil Materials
- Rock Test
- Soil Test
Calibrate your rock’s strength criteria and observed stress-strain behaviours using field and lab test data and compare them against numerical simulations of the same tests.
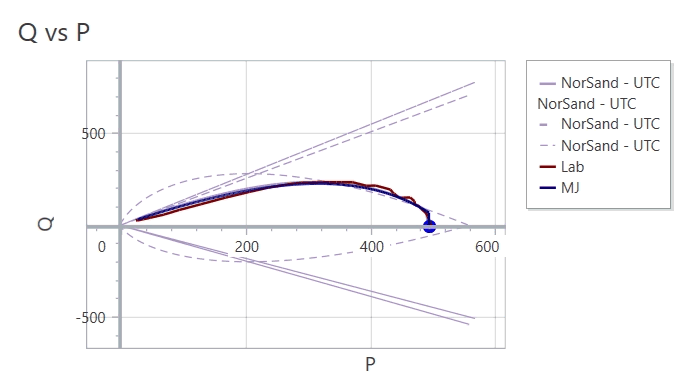
Article: Material Models Made Easy
Laboratory tests and stress-strain paths of soils can be imported into RSData for visualization. Compare & calibrate material parameters by plotting predicted constitutive behaviour on top of experimental data. RSData is a virtual soil mechanics lab, allowing you to study different constitutive models in prediction of typical laboratory tests.
Article: Triaxial Test of NorSand


Streamline your workflow by importing your material strength properties directly into Slide2 to be used for numerical analysis.
Streamline your workflow by importing your material strength properties directly into Slide3 to be used for numerical analysis.
Streamline your workflow by importing your material strength properties directly into RS2 to be used for numerical analysis.
Streamline your workflow by importing your material strength properties directly into RS3 to be used for numerical analysis.

Streamline your workflow by importing your material strength properties directly into Slide2 to be used for numerical analysis.

Streamline your workflow by importing your material strength properties directly into Slide3 to be used for numerical analysis.

Streamline your workflow by importing your material strength properties directly into RS2 to be used for numerical analysis.

Streamline your workflow by importing your material strength properties directly into RS3 to be used for numerical analysis.
-
Stress Path Graphs
Get in-depth insight into stress-strain behaviours and constitutive models of your materials.
-
Customizable Graphs
Get the most control of your data by modifying value ranges, data sets and more. With stress path graphs, you can plot any two stress/strain or their invariants against each other.
-
Animation Feature
Make your data come to life with the visualization of test progress and the evolution of hardening/softening rules in the constitutive models.


Get in-depth insight into stress-strain behaviours and constitutive models of your materials.

Get the most control of your data by modifying value ranges, data sets and more. With stress path graphs, you can plot any two stress/strain or their invariants against each other.

Make your data come to life with the visualization of test progress and the evolution of hardening/softening rules in the constitutive models.
Perpetual
One-time purchase- Own the version of your license in perpetuity
- Maintenance+ subscription included in first year
- Install on one computer
Lease
Ongoing subscription- Maintenance+ subscription
- Ongoing bug fixes
- Continuous new features
- Install on one computer