Note that Estimate P32 From Traverse Data can only be used for Linear or Borehole traverses with at least two fractures and unique Distance
values. This feature cannot be used if the DIPS file does not contain any Linear or Borehole traverses.
Chilès Method
Chilès methodology to calculate P32 from P10 is based on Terzaghi weighting. The first step is to define P10 zones using the methodology outlined in Define P10 Zones.
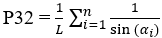
For fractures in a P10 zone, the P32 of that zone can be estimated as follows:
where:
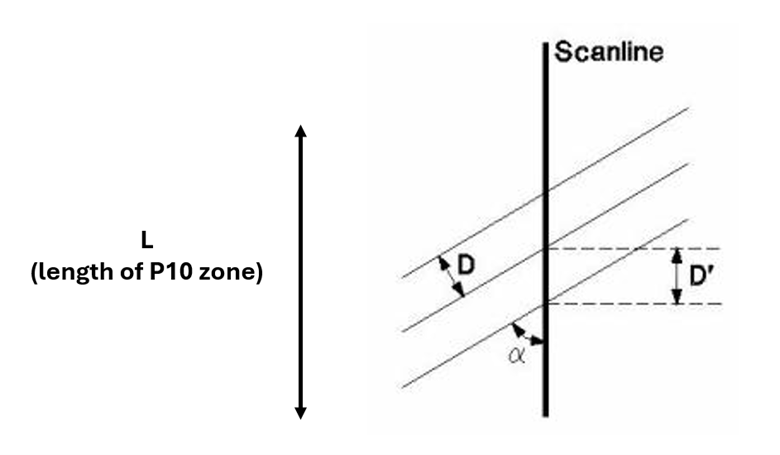
α = minimum angle between the fracture and Traverse
D’ = apparent spacing along Traverse
D = D’ sin a = D’ (1/W) = true spacing of discontinuity set
R’ = 1/D = 1/D’ sin a = D’ cosec a = true density of joint population
where n = the number of fractures in the P10 zone, αi is the α of fracture i, and L is the length of the P10 zone
Similar to Terzaghi weighting, P32 values estimated using this methodology tend to infinity as alpha (α) approaches zero. As a result, a maximum limit for P32 must be set to prevent unreasonable results. This maximum limit corresponds to a minimum angle, which can be between 1° and 89.9°. However, the recommended range is limited to 5° to 25°, and the default is set to 15°. The user can change this limit with the Minimum Bias Angle option in the Define P32 From Traverse Data dialog.
Cumulative Fracture Intensity (CFI) Plot
A CFI plot plots the cumulative number of fractures (along a Linear or Borehole traverse) against the depth or distance. It allows you to identify any changes in P10 (fracture frequency) along a Linear or Borehole traverse. Note that the fracture data in a CFI plot correspond to the selected Data source in the Intensity section.
Estimating P32 From Traverse Data
To estimate P32 from traverse data:
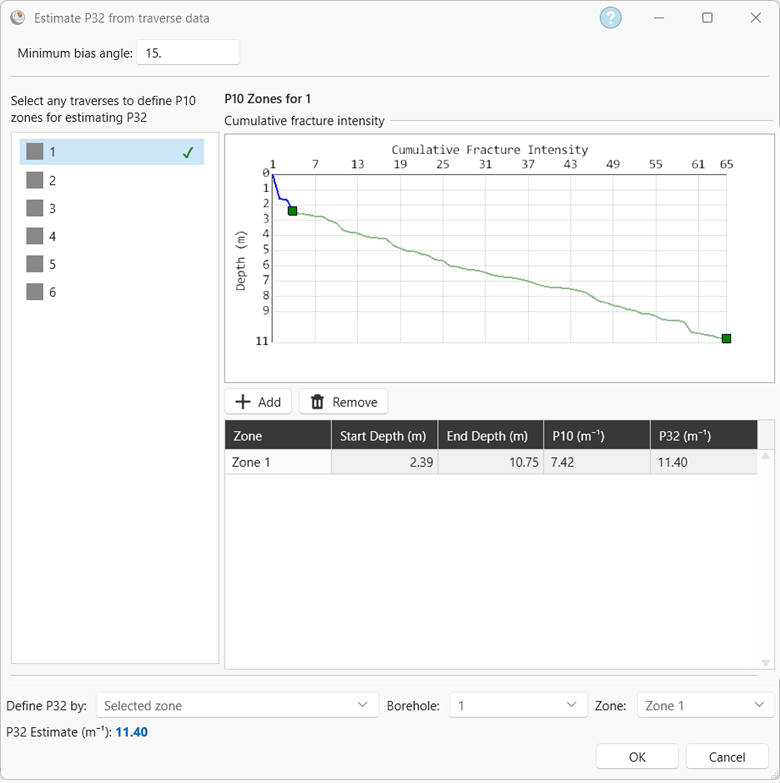
Click Estimate P32 from traverse data to open the dialog
The left-hand side contains a list of Linear or Borehole traverses with fractures and their Distance value. Select a traverse to view its Cumulative Fracture Intensity (CFI) plot and define P10 zones on the plot. These P10 values will be converted to P32 using Chiles method.
To add a P10 zone on the traverse CFI plot, click the Add button. The P10 zone appears as a green line on the CFI plot and in the table below the plot. The table below the CFI plot shows the start point, end point, P10, and P32 of each zone defined in each traverse.Estimate P32 From Traverse Data dialog with one P10 zone defined
P10 zones should be defined for zones where the slope of the CFI plot is constant. When defining a P10 zone, the initial drop at the beginning of the CFI plot can be ignored, as this is due to a lack of fractures at the beginning of drilling.
You can change the start and end points of a zone by first selecting it in the table and then either dragging the green squares on the CFI plot or changing the values in the table.
A green checkmark appears next to the Linear or Borehole traverse after a P32 value has been defined for it.
There are three options to choose which P32 value to use:
Selected zone:
This uses the P32 value of one zone. The traverse and zone need to be defined.
Average of all zones (one traverse): This takes the average P32 of a specified traverse.
Average of all zones (all traverses): This takes the average P32 of all zones in all traverses.
P10 zones cannot overlap and they are listed in the table in sequential order (according to their Distance value).
Note that defining P10 zones should be based on geotechnical domains. They should not be defined on a run-by-run basis (i.e., on a 1.5 m – 3 m basis). There may be instances where the total depth of a CFI plot for a borehole is smaller than 5 – 10 m. In this case, it is recommended to not define P10 zones for this borehole, as there is not enough information on geotechnical domains.
Changes in P10 values should be considered relative to fracture spacing. For example, a P10 of 1 is significantly different from a P10 of 2, as the average spacing of P10 = 1 m-1 is 0.5 m, while the average spacing of P10 = 2 m-2
is 0.33 m. As P10 values increase, the difference in their average spacing decreases; the average spacing for a P10 = 5 m-1 is 0.167 m, while the average spacing for a P10 = 6 m-1 is 0.14 m. When defining P10 zones along a Linear or Borehole traverse, it is recommended to use P10 increments of 0.5 when working with lower P10 values. Higher P10 values (ex; P10 >= 4 m-1) can be grouped into one zone, as there is minimal geotechnical difference in their values.
If a Linear or Borehole traverse has more than one P10 zone with different geotechnical domains, then it is recommended to generate a DFN for each domain.
Fracture generation stops once the calculated P32 value has been reached.
Reference
Chilès, J.P.; Wackernagel, H.; Beucher, H.; Lantuéjoul, C.; Elion, P. Estimating fracture density from a linear or areal survey. In Proceedings of the Eighth International Geostatistics Congress, Santiago, Chile, 1–5 December 2008; Ortiz, J.M., Emery, X., Eds.; Gecamin Ltda: Santiago, Chile, 2008; pp. 535–544.
 button. The P10 zone appears as a green line on the CFI plot and in the table below the plot. The table below the CFI plot shows the start point, end point, P10, and P32 of each zone defined in each traverse.