Automatic Cluster Analysis
The Automatic Cluster Analysis option uses fuzzy cluster analysis to automatically determine discontinuity sets on the stereonet from orientation and quantitative rock mass characterization data. The Automatic Cluster Analysis requires the user to specify a range of clusters (i.e., sets) to analyze and then automatically determines which poles belong to which cluster. The user can then toggle through the results for each specified cluster value and select which result they want to use. To help guide users when selecting which result to use, a clustering evaluation metric is provided with each result. The evaluation metric used is the Silhouette score. It ranges from -1 to 1, where a value of 1 means that the clustering results are high quality (each point in a cluster is similar to other points in the cluster and dissimilar to points in other clusters) and a value of -1 means that the clustering results are low quality (each point in a cluster is more similar to points in other clusters than in its cluster). A Silhouette score is calculated for each point, and then the scores are averaged for the dataset.
Once the poles belonging to a set have been determined, the mean plane orientation and set statistics are calculated in exactly the same way as for other methods of set creation (e.g., Set Windows). However, Set Windows are not visible for sets determined from Automatic Cluster Analysis.
Note that this option can only be used when Use automatic cluster analysis is enabled in the Project Settings.
To create Automatic Cluster Analysis sets:
- Ensure that Use automatic cluster analysis is checked under Project Settings. If there are manual sets (sets determined with Add Curved Set Window, Add Circular Set Window, Add Freehand Set Window, and Set Cluster Analysis) in the project, then switching to using automatic cluster analysis will delete those sets.
- Select Sets > Automatic Cluster Analysis
 button from the Stereonet 2D ribbon.
 - In the first page (Analysis setup) of the Automatic Cluster Analysis wizard, specify the following inputs:
- Data to cluster: the user can select which poles they want to cluster from a list of filters in the file. The default option is to cluster all (unfiltered) data. The selected data is displayed on the input stereonet.
- Additional columns (optional): extra quantitative data in the grid data can be selected. The clustering analysis will analyze orientation and any selected extra data. Note that this is optional; if no columns are available or none are selected, then the clustering analysis will only analyze the selected orientation data.Clustering qualitative data requires an Internet connection and this data will be shared with OpenAI
- Clustering parameters: these inputs control the clustering algorithm.
- Weighted: selecting this will apply Terzaghi weighting to the data for clustering.
- Cluster range: the minimum and maximum number of clusters to analyze.
- Minimum membership degree (%): this controls which poles are considered outliers (i.e., not in a cluster). Each pole is assigned a probability that it belongs to a cluster (ex; pole 1 has a 60% probability it belongs to cluster 1, 25% probability it belongs to cluster 2, and 15% probability it belongs to cluster 3). This probability represents the membership degree of a pole to a cluster. The minimum membership degree is the minimum membership (or probability) that a pole must have to in a cluster to be considered part of that cluster. Higher values will result in smaller clusters, while lower values will result in larger clusters.
- Confidence interval (%): the confidence limit of the mean set pole. See Set Statistics for more information.
- When you are ready to cluster, choose the Next button in the wizard. A progress bar will appear to show the progress of the cluster analysis.
- Once clustering is complete, the wizard will move to the Cluster results page. The Cluster results page of the wizard allows you to toggle through the results for the number of clusters specified in the Cluster range in the Analysis inputs page.
- Each dropdown option in Number of clusters shows the number of clusters and its Silhouette score.
- The cluster results for the selected dropdown option in Number of clusters are displayed as colour-coded poles, mean set poles, and confidence limits on the results stereonet. The colour of each cluster can be changed by using the Custom colors button under the Viewport settings or by right-clicking in the results stereonet.
- The legend, mean set poles, and confidence limits in the results stereonet can be toggled on and off under the Viewport settings or by right-clicking in the stereonet.
- The Set statistics table is also updated with the Number of clusters selection. This table displays the number of poles, dip and dip direction of the mean set plane, Fisher K, and confidence limit for each cluster.
- After selecting the cluster results that you are happy with from the Number of clusters dropdown, select the Finish button to accept these results and close the wizard.
- The mean set poles and planes will be drawn for each cluster on the main stereonet.
- To plot the poles by their cluster set, select Pole Vectors in the Visibility tree. In the Properties pane, select Symbolic By Set in the Pole Mode dropdown.
It is important to note the following regarding the Automatic Cluster Analysis option.
Clustering Additional Columns
The Automatic Cluster Analysis wizard supports clustering orientation data or a combination of orientation and quantitative rock mass characterization data. Clustering both orientation and quantitative data can provide more insights into the data, as doing so can identify sets that are missed when clustering only orientation data, such as overlapping sets, subjoints, and bedding planes or faults. AI-powered vector embeddings are used to transform qualitative data into numeric values for clustering.
Note that any data in selected qualitative columns will be shared with OpenAI. Additionally, clustering qualitative columns requires an Internet connection throughout the entire clustering process.
Missing Data
If any selected additional columns have missing values, a warning message will appear.
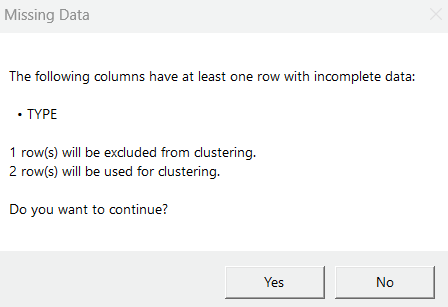
The warning message displays the amount of excluded data (number of rows with missing values) and the amount of data (number of rows) that will be used for clustering if you want to continue with the wizard. If the amount of data used for clustering is significantly smaller than the total amount of data selected in Data to cluster, then this can lead to misleading clustering results. You can deselect additional column(s) with a large number of missing values or fill in the missing values in the Orientation Data dialog to minimize this possibility.
If there is not any data available for clustering after excluding data with missing values, then a warning message will appear.
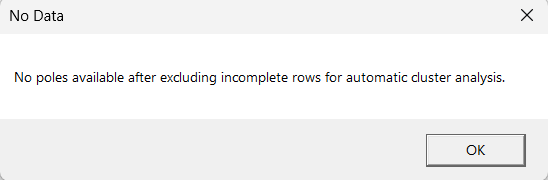
To continue using the Automatic Cluster Analysis wizard, select a different option in the Data to cluster drop down, deselect additional column(s) with missing values, or fill in the missing values in the Orientation Data dialog.
Set Statistics from Automatic Cluster Analysis
Once a cluster has been determined, the Mean Set Plane orientation and Set statistics are calculated using exactly the same method as sets determined by other methods available in DIPS (i.e., the various Set Window options). In other words, for a given grouping of poles, the mean orientation and set statistics will be exactly the same, regardless of the method used to create the set in DIPS.
Set Windows and Mean Set Planes from Automatic Cluster Analysis
Unlike the manual set determination methods, Set Windows are NOT visible for sets determined from Automatic Cluster Analysis, as there may be overlapping sets if quantitative data is used in the clustering. Additionally, Mean Set Planes cannot be edited, nor can they be individually deleted. Only Delete All can be used with sets from Automatic Cluster Analysis.
References
The Automatic Cluster Analysis wizard in DIPS uses the fuzzy cluster algorithm presented in the following paper. Click the link to view the paper:
Fuzzy Cluster Algorithm for the Automatic Identification of Joint Sets, R.E. Hammah, J.H. Curran, International Journal of Rock Mechanics & Mining Sciences, Vol.35, No. 7, pp.889-905, 1998.
For more information on Silhouette score, please refer to the following paper:
Silhouettes: A Graphical Aid to the Interpretation and Validation of Cluster Analysis. P.J. Rousseeuw, Computational and Applied Mathematics, Vol.20, pp.53-65, 1987.