Define P10 Zones
If P10 is selected as the Intensity measure method, then P10 zones and a stopping condition need to be defined. P10 zones are zones along a Linear or Borehole traverse (e.g., Linear Scanline, Linear Borehole Oriented Core, Linear Borehole Televiewer, Curved Borehole Oriented Core, Curved Borehole Televiewer) where the slope of the Cumulative Fracture Intensity (CFI) plot remains constant.
Note that P10 zones can only be defined for Linear or Borehole traverses with at least two fractures and unique Distance values. P10 zones cannot be defined if the DIPS file does not contain any Linear or Borehole traverses.
Cumulative Fracture Intensity (CFI) Plot
A CFI plot plots the cumulative number of fractures (along a Linear or Borehole traverse) against the depth or distance. It allows you to identify any changes in P10 (fracture frequency) along a Linear or Borehole traverse. Note that the fracture data in a CFI plot correspond to the selected Data source in the Intensity section.
Defining P10 Zones
To define P10 zones:
- Click Define P10 zones to open the dialog
- The left-hand side contains a list of Linear or Borehole traverses with fractures and their Distance value. Select a traverse to view its Cumulative Fracture Intensity (CFI) plot and define P10 zones on the plot.
- To add a P10 zone on the traverse CFI plot, click the Add
 button. The P10 zone appears as a green line on the CFI plot and in the table below the plot. The table below the CFI plot shows the start point, end point, and P10 of each zone defined in each traverse.
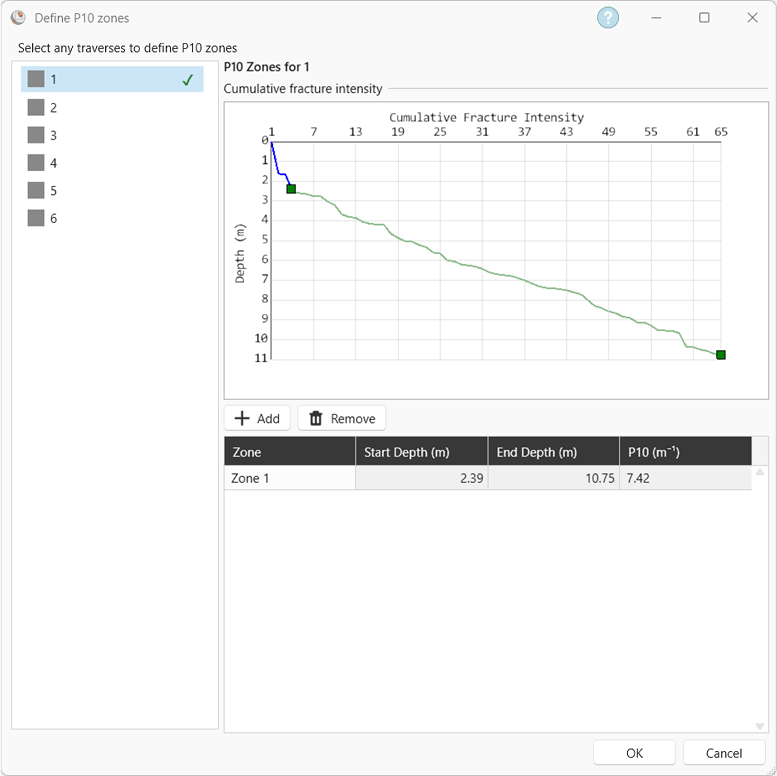
Define P10 Zones dialog with one P10 zone defined in Traverse 1 - P10 zones should be defined for zones where the slope of the CFI plot is constant. When defining a P10 zone, the initial drop at the beginning of the CFI plot can be ignored, as this is due to a lack of fractures at the beginning of drilling.
- You can change the start and end points of a zone by first selecting it in the table and then either dragging the green squares on the CFI plot or changing the values in the table.
- A green checkmark appears next to the Linear or Borehole traverse after a P10 zone has been defined for it.
P10 zones cannot overlap and they are listed in the table in sequential order (according to their Distance value).
Note that defining P10 zones should be based on geotechnical domains. They should not be defined on a run-by-run basis (i.e., on a 1.5 m – 3 m basis). There may be instances where the total depth of a CFI plot for a borehole is smaller than 5 – 10 m. In this case, it is recommended to not define P10 zones for this borehole, as there is not enough information on geotechnical domains.
Changes in P10 values should be considered relative to fracture spacing. For example, a P10 of 1 is significantly different from a P10 of 2, as the average spacing of P10 = 1 m-1 is 0.5 m, while the average spacing of P10 = 2 m-2 is 0.33 m. As P10 values increase, the difference in their average spacing decreases; the average spacing for a P10 = 5 m-1 is 0.167 m, while the average spacing for a P10 = 6 m-1 is 0.14 m. When defining P10 zones along a Linear or Borehole traverse, it is recommended to use P10 increments of 0.5 when working with lower P10 values. Higher P10 values (ex; P10 >= 4 m-1) can be grouped into one zone, as there is minimal geotechnical difference in their values.
If a Linear or Borehole traverse has more than one P10 zone with different geotechnical domains, then it is recommended to generate a DFN for each domain.
Stopping Condition
A stopping condition needs to be selected after defining P10 zones. This stopping condition controls when fracture generation stops. The Baecher DFN Wizard has the following three stopping conditions:
- First zone: Fracture generation stops when the P10 of ones of the zones has been reached. This tends to produce the least number of fractures and can result in some P10 zones with a simulated P10 of 0 m-1.
- Average of zones: Fracture generation stops once the average of the P10 zones has been reached. This can produce some P10 zones with a simulated P10 of 0 m-1.
- All zones: Fracture generation stops once the P10 of each zone has been reached. This tends to produce the highest number of fractures.