Rocscience acquires 3GSM. Read more

Search Results

User Data

With the User Data option, the user is not limited to viewing principal stresses and displacements only, but can create contour plots of:

  • Any stress tensor component
  • Any displacement component
  • Write a mathematical expression containing these components, and view the results of this function

Creating and Plotting User Data

To view contours of User Data:

  1. Select: Interpret > User Data. You will be prompted with the dialog. You must first define the data.
  2. In the Equation box, type the equation.
    Equation Box
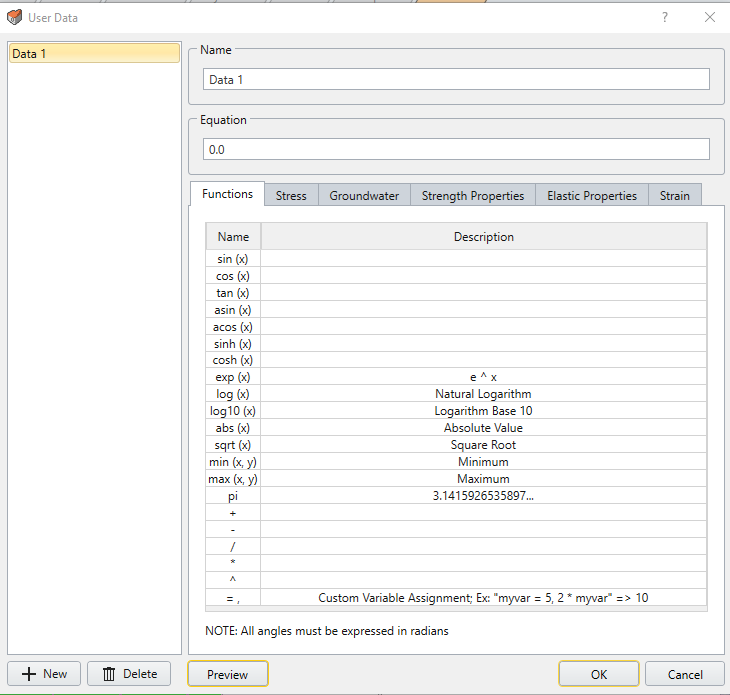
  3. Once User Data has been defined, It can then be selected like any other data type (e.g. Sigma 1, Strength Factor etc), and a contour plot of the selected User Data will be generated. Select Preview button to see the equation applied to the contour plot.
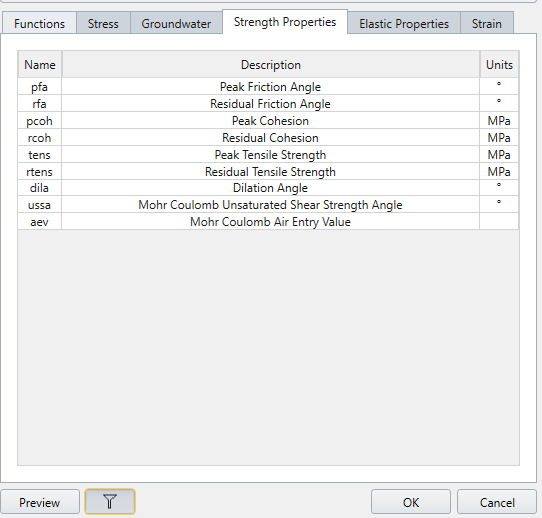
  4. The Strength Properties and Elastic properties allows users to view only the parameters that are used for the specific model. Simply select the Filter data Filter Data icon to see the parameters used for the model.
    Filter Data window
Rocscience logo, click here to return to the homepage Portal Account Portal Account Log In Log Out Home Shopping Cart icon Click here to search our site Click here to close Learning Tech Support Documentation Info Chevron Delete Back to Top View More" Previous Next PDF File Calendar Location Language Fees Video Click here to visit Rocscience's LinkedIn page Click here to visit Rocscience's YouTube page Click here to visit Rocscience's X page Click here to visit Rocscience's Facebook page Click here to visit Rocscience's Instagram page Click here to visit Rocscience's Reddit page Bookmark Network Scroll down for more Checkmark Download Print Back to top Single User Multiple Users RSLog RocFall3 CPillar Dips EX3 RocFall RocPlane RocSlope RocSupport RocTopple RS2 RS3 RSData RSPile Settle3 Slide2 Slide3 SWedge UnWedge RocTunnel Commercial License Education License Trial License Shop safe & secure Money-back guarantee