Import 3vGeomatics Data
This feature allows users to import radar data, for ground movement, provided by 3vGeomatics. The import procedure includes File Loading, Data Type/Property Selection, and Data Filtering and Geometry Preview.
- Select: File > Import > Import Sensor Data > Import 3vGeomatics Data or Interpret > Import Sensor Data > Import 3vGeomatics.
- The Open File dialog will appear. This dialog only accepts .csv files. After selecting the .csv file you wish to import, select OK.
- The Import 3vGeomatics Data dialog will appear.
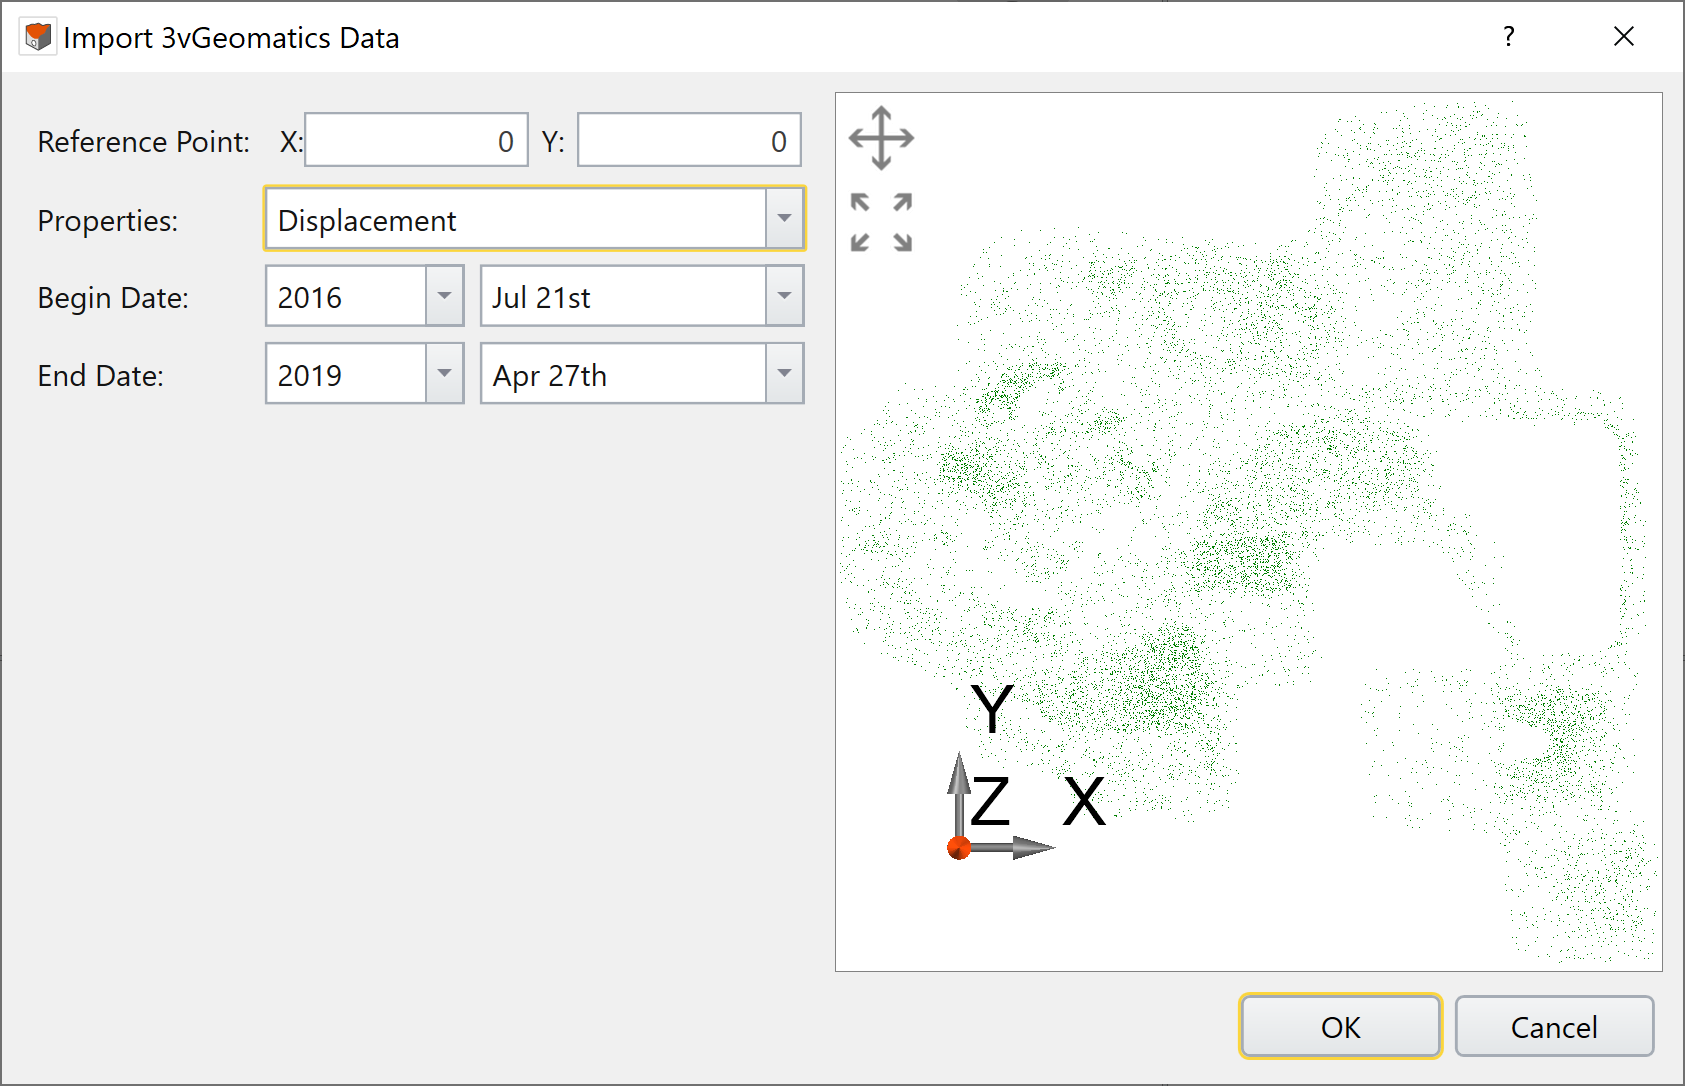
On the right side, there is a viewport that displays the coordinates in a point cloud. The viewport allows users adjusting the view by clicking on the “Pan” button and moving the mouse with the left button pressed, or zooming in and out by scrolling the mouse wheel. Users can go back to the default view by clicking the “Zoom Fit” button. The viewport also enables users to select the reference point on the point cloud in the view by clicking the mouse’s left button.
According to the documentation from 3vGeomatics, they have three formats: Displacement with XO markers (the “x” and “o” indicate if the displacement result has been interpolated or not), Displacement without XO markers, and Instantaneous Velocity. Displacement without XO markers is the only format that we currently support.
On the left side of the dialog, the user can select the Data Type/Property. Reference Point is used as the origin for geometry rendering. Users can set the reference point by either entering the values in the text boxes or clicking on the point cloud in the viewport on the right. The reference point is the first point in the file by default, and it is already converted to its local coordinate if the points are saved as longitude/latitude in the file. The default value of reference point is (0.0, 0.0). The values displayed are accurate to four decimal places by default. The users can enter values to set the reference point according to their needs.
Properties contains all the available properties to import from the file. For now, Displacement is the only available option available.
Begin and End Date list all the dates saved in the Tre Altamira file. The measured data on the End Date will be imported as radar map values.
If users click Cancel button, the import process will abort and return to the main window. When OK button is clicked, it will move to the next stage.
- The Edit Point Cloud dialog will appear.
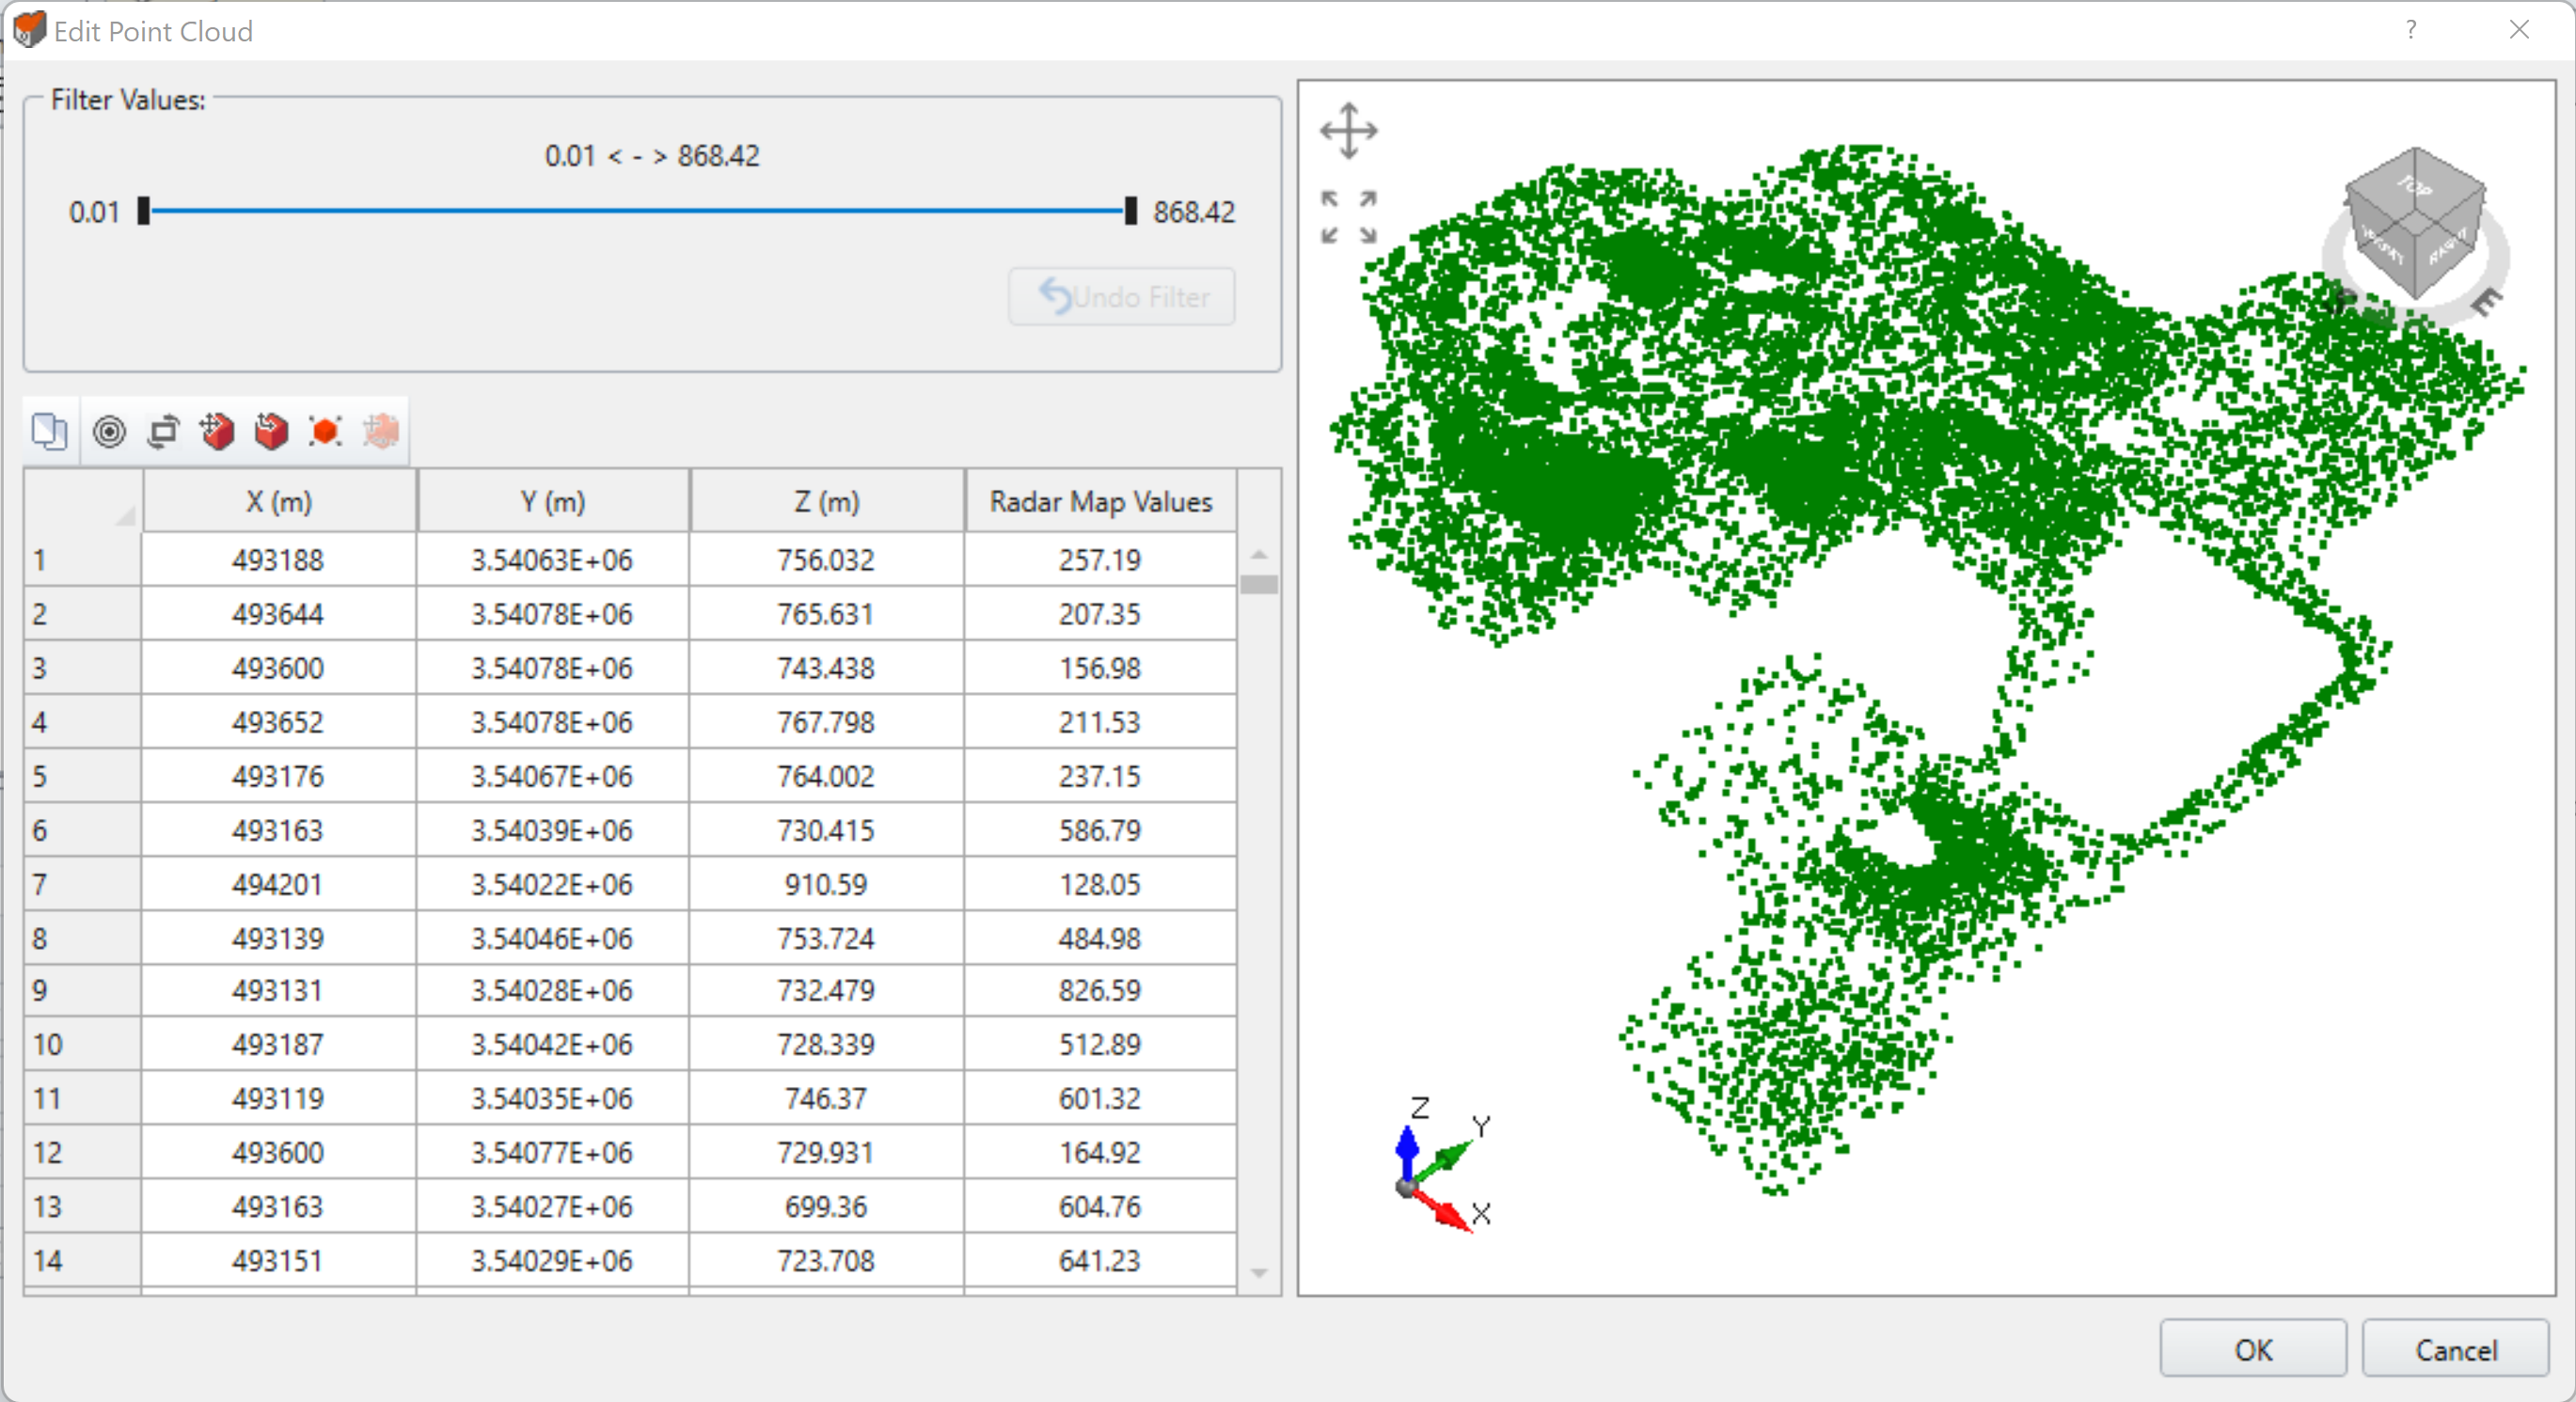
A preview of the data is displayed in the viewport on the right side of the dialog. The Filter Values section allows the user to customize the range of values they want displayed in the radar map. Moving the cursor will update the viewport with the data that falls within the customized range.Select OK to create the map.
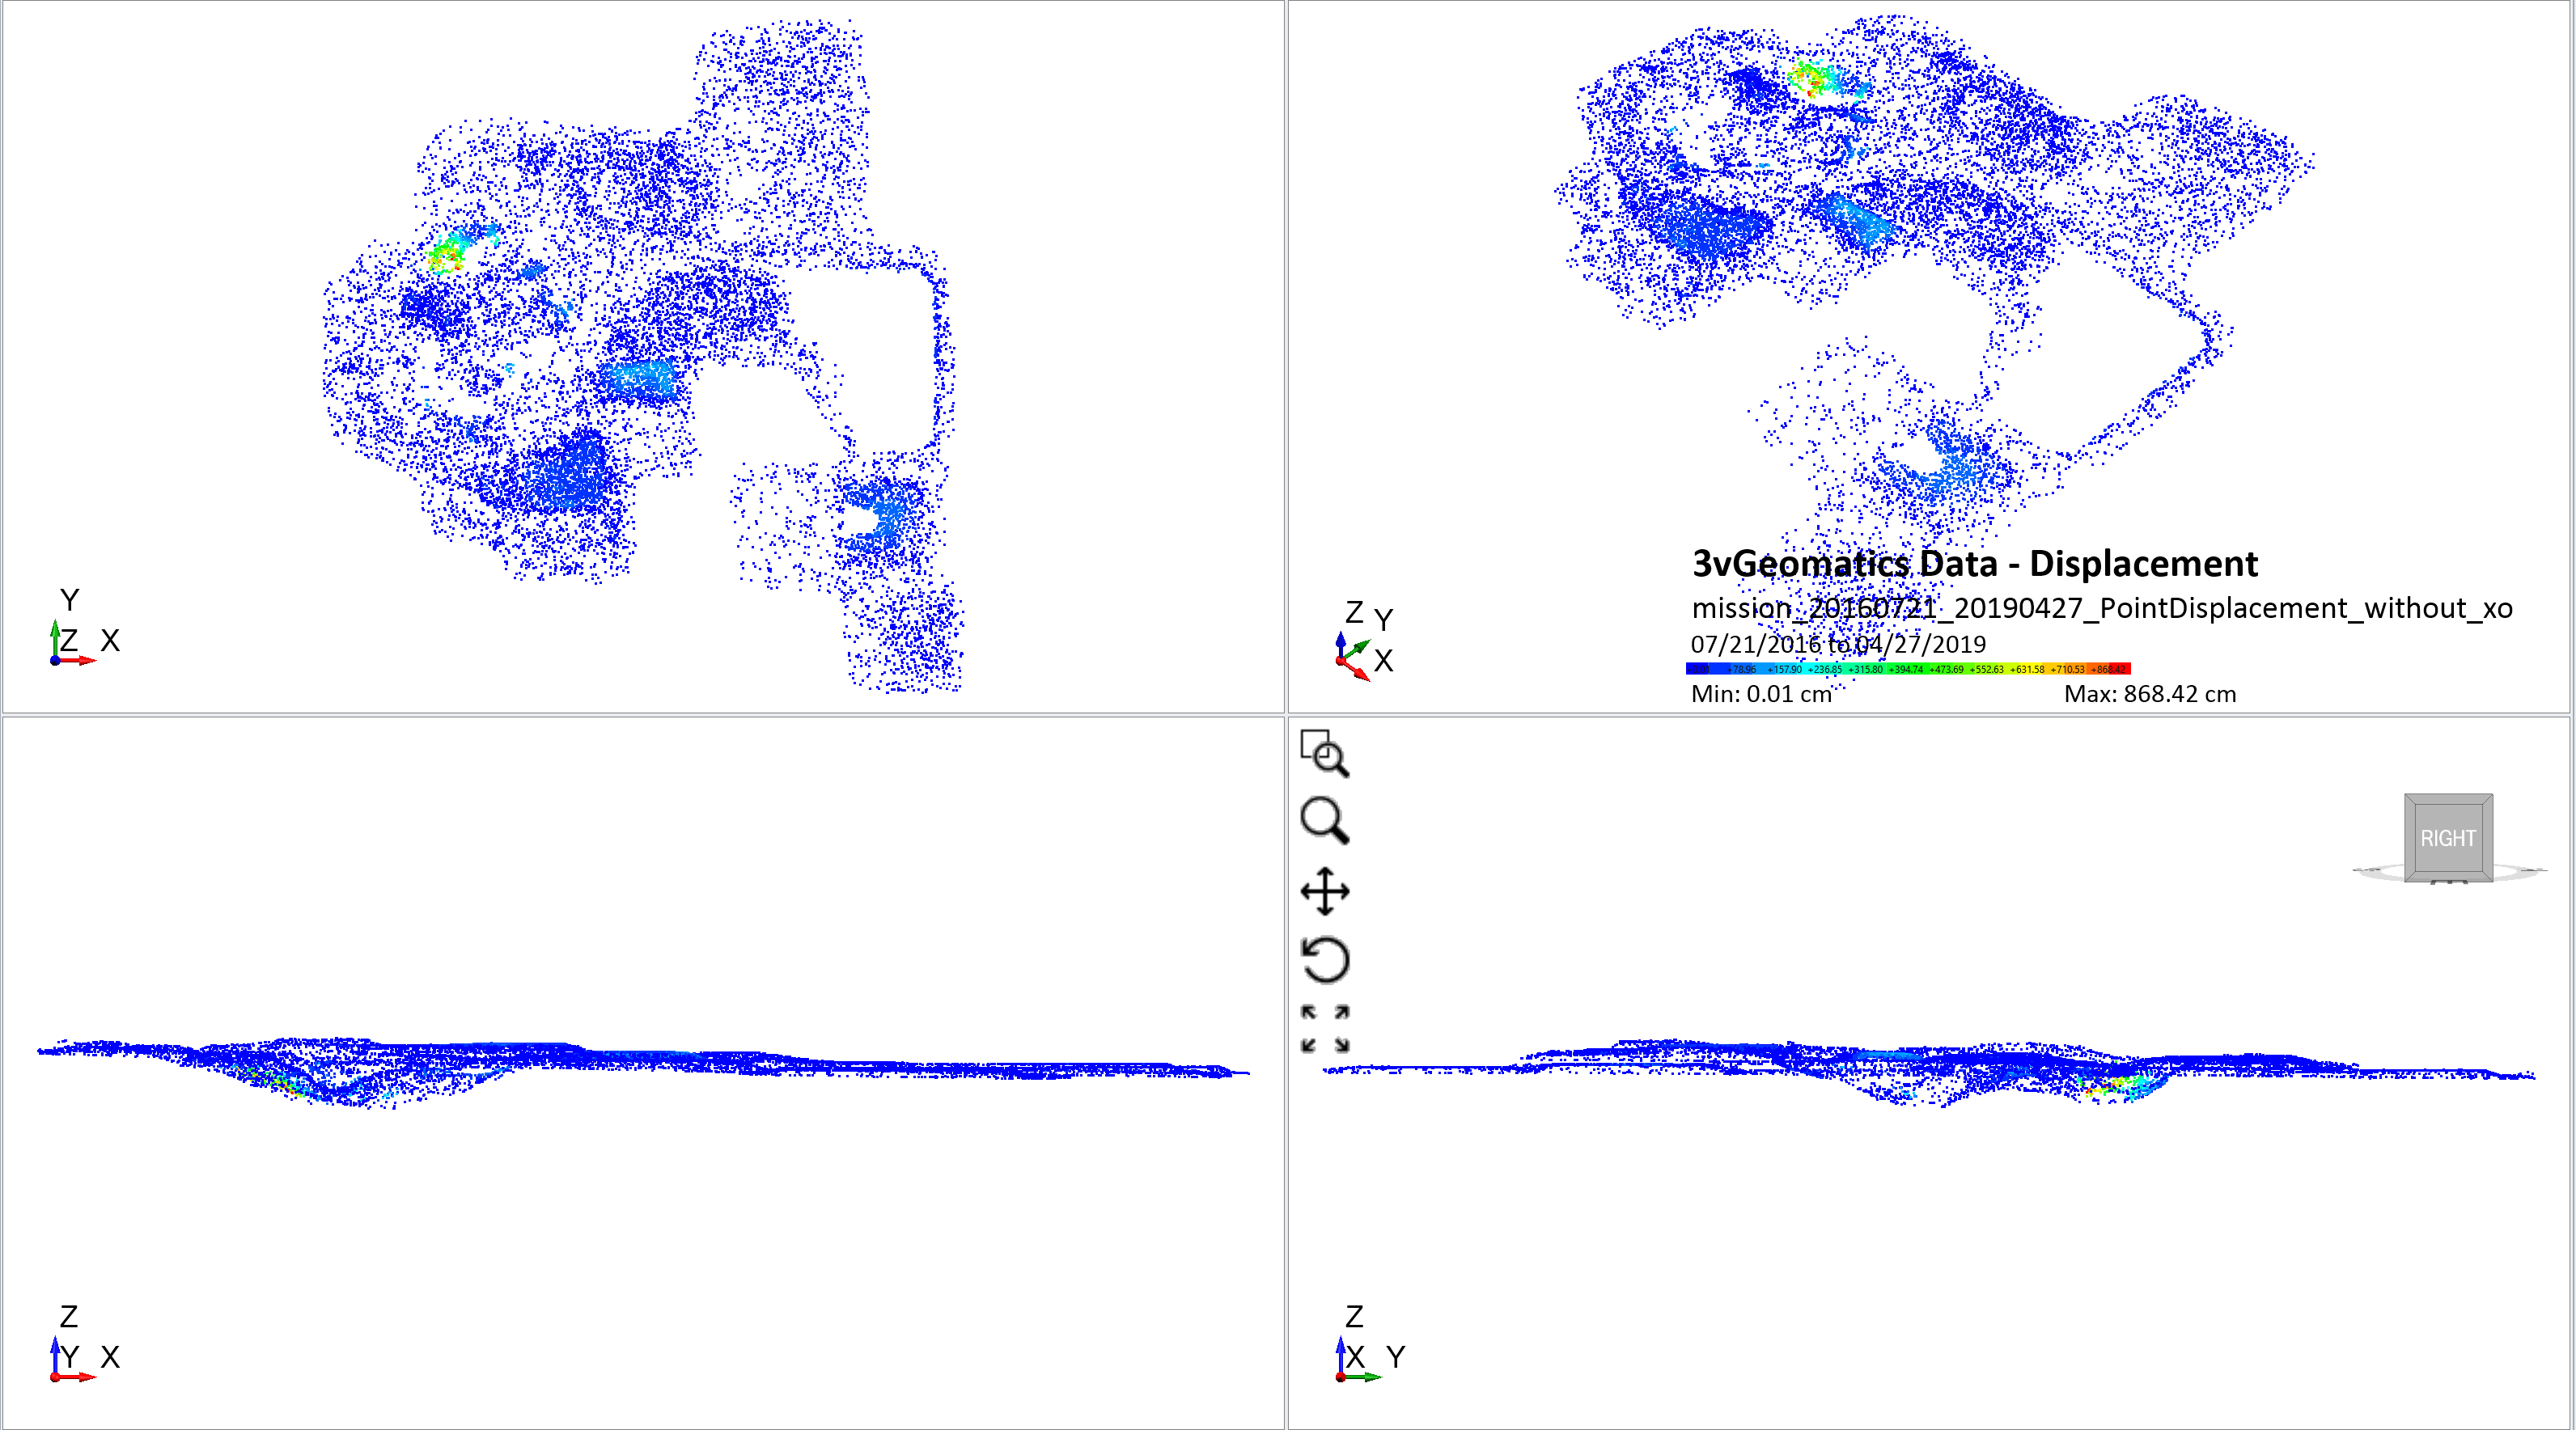
Below shows an example of 3vGeomatics imported displacement data. The red and yellow regions show the locations of highest displacement.