Contour Options
After results are computed, you can define contour options by:
- Select Interpret > Contour Legend > Contour Options or select the Contour Options
 icon from the top right corner of the Legend pane on Results
  workflow tab.
You will be able to define the following range of contours as shown below:
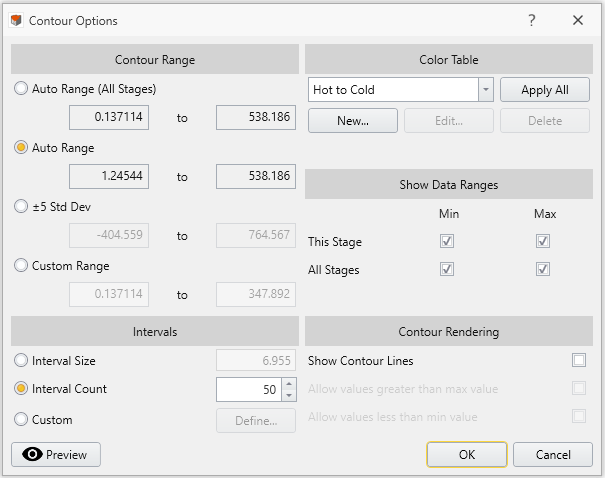
Contour Range
- Auto Range (All Stages): Allows RS3 to define range of contour for all stages. This option is available when results for ALL STAGES are loaded.
- To enable this option, click through each stage tab to load results for each, until results for all stages are loaded. In RS3, the results of a stage will not be loaded unless the stage is selected to display.
- To enable this option, click through each stage tab to load results for each, until results for all stages are loaded.
- Auto Range: Allows RS3 to select the range of contour.
- Std Dev: Allows you to define range of standard deviation of plus/minus the range of standard deviation for contour range.
- Custom Range: Allows you to define the range of contour with the user-defined value.
- You can choose to enable the Allow values greater than max value or (and) the Allow values less than min value option(s) under the Contour Rendering section.
- You can choose to enable the Allow values greater than max value or (and) the Allow values less than min value option(s) under the Contour Rendering section.
Intervals
- Interval size: You can define the interval range of contour to be displayed.
- Interval count: You can define the number of intervals of contour range to be displayed in the model.
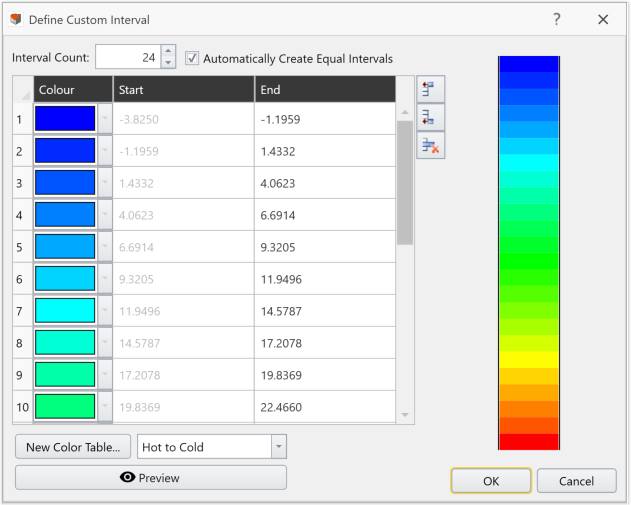
- Custom: You can customize the colors with the interval of interest as shown below:
Contour Table
The color table options are described below. You can apply the setting by selecting 'Apply All' and it will apply to all stages.
- 16 Color Display – uses 14 colours and intervals (black and white are not used, which is why only 14 instead of 16 are actually used).
- DOS Style – uses exactly the same 7 colours and number of intervals as the original Rocscience DOS-based programs (e.g. Phase2 v. 3.0).
- Cold to Hot – uses a red to blue range of contouring, simulating a "cold to hot" effect. “Cold” region is in color red, “hot” region is in color blue.
- Hot to Cold – uses a blue to red range of contouring, simulating a "hot to cold" effect. “Hot” region is in color red, “cold” region is in color blue.
- Hot Spots – uses a white to red range of contouring, simulating a "hot spot" effect.
- Black to White – uses black to white contouring, and 7 intervals.
- Examine 3D – bases on the contour range of the Examine 3D program, which was one of the first Rocscience programs.
- Turbo Color
This option allows you to apply contour map that is more distinguishable to our eyes. More explanation on improved rainbow color map for visualization is provided here: https://ai.googleblog.com/2019/08/turbo-improved-rainbow-colormap-for.html
When applied, the Hot to cold vs Turbo colour option can be shown below: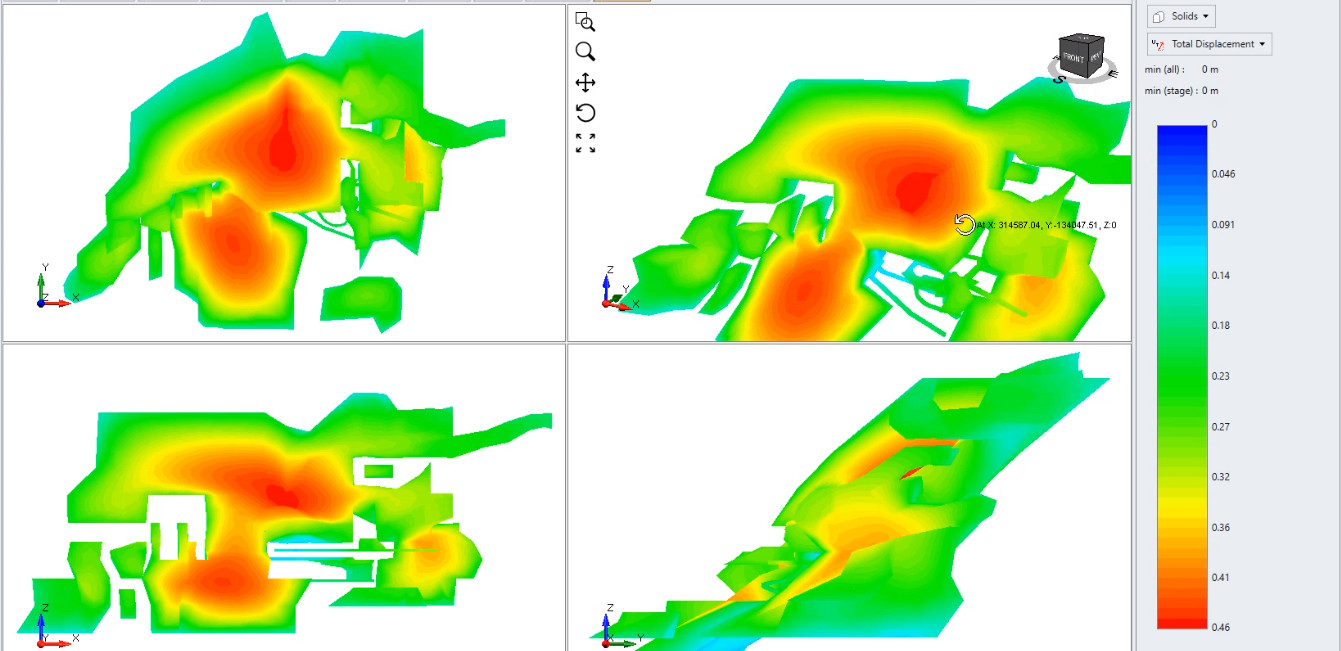
Hot to Cold Figure 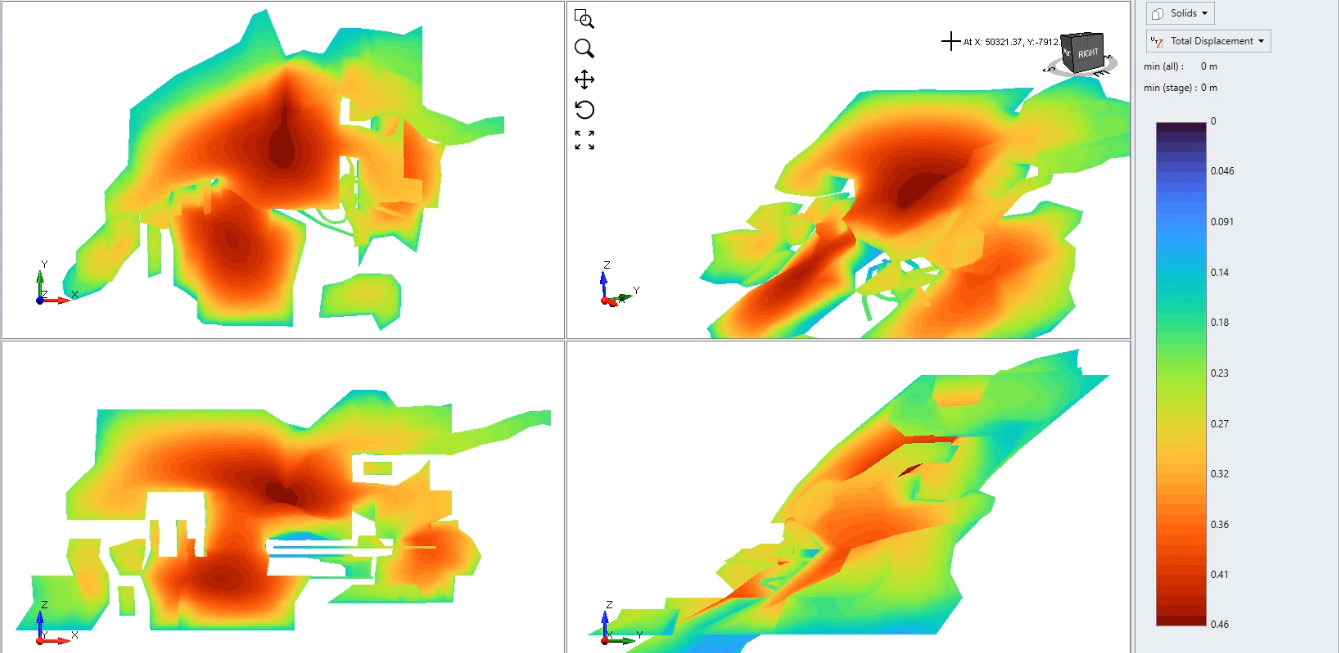
Turbo Colour Figure - Visually Distinct – the color of each contour interval is visually distinct from its adjacent contour intervals.
The Define Color Table option gives the user maximum flexibility to define their own customized contour option. To use this option:
Define Color Table
- Select the New button under the Color Table section, you will be prompted to a dialog.
- Use the options in the Define Colours dialog, to create a new color table style.
- When you are finished, select OK (the new color table will be saved in a file with an *.RAF filename extension).
- Your newly defined color table will then appear in the Color Table list in the Contour Options dialog, and can be used like any of the default Color Table options.
- You can Edit or Delete any user-defined color table style.
Show Data Ranges
Allows you to show min/max contour values for each stages or all stages. This becomes useful if you're only interested in maximum or minimum results of the model.
Contour Rendering
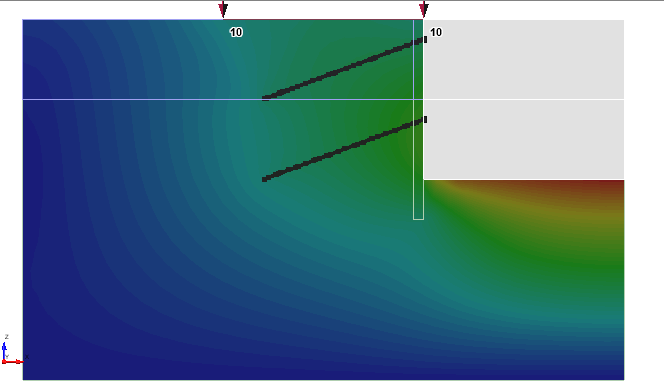
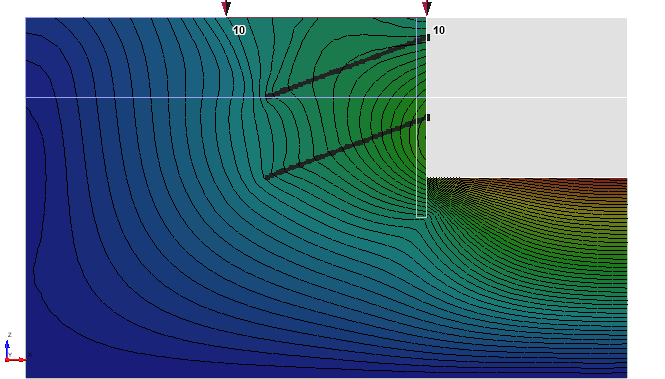
Show Contour Lines
When the Show Contour Lines option is selected, lines will be displayed to the contour. Below shows an example of the Show Contour Lines option.
 |  |
Allow values greater than max value / Allow values less than min value
These two options are only available for Contour Range = Custom Range. By default, the two options are off, where the contour within the user-defined range will be displayed, and the contour outside of the range will not be displayed. When the Allow values greater than max value option is selected, the contour greater than the user-defined max range will be displayed with the max value contour color. When the Allow values less than min value option is selected, the contour less than the user-defined min range will be displayed with the min value contour color.