Users of RS3 can import live radar data and display it into 3D space and compare with RS3 models. Users can import data from radar systems manufactured by
GroundProbe which is used for the monitoring of slope displacements in mining and civil operations as well as many other applications. The imported radar data is displayed
alongside RS3 model results for easy comparison.
Go to File > Import > Import Sensor Data > Import GroundProbe Data or
Interpret > Import Sensor Data > Import GroundProbe Data
The Open File dialog will appear. This dialog only accepts .csv files. After selecting the .csv file you wish to import, select OK.
Opening the .dat or .csv file of interest will prompt the Import CSV File dialog to open. The user can customize the method with which the program sorts through the data by selecting the type of
Data Delimiter from the list below:
Comma
Semi-Colon
Space
Tab
Pipe
All
The user can also change the Start Row of the .dat or .csv file. The Data Value Enabled option allows the user to display data at each (X,Y,Z) coordinate. Some data imports only
require coordinates while others like GroundProbe data include a data value for each set of coordinates. The data can be anything, depending on the tool that uses the dialog.
In the Data Column Selection section, the user can select which columns from the source file are displayed.
If the values from the table represent the X,Y,Z coordinates of the radar data, then select OK to proceed.
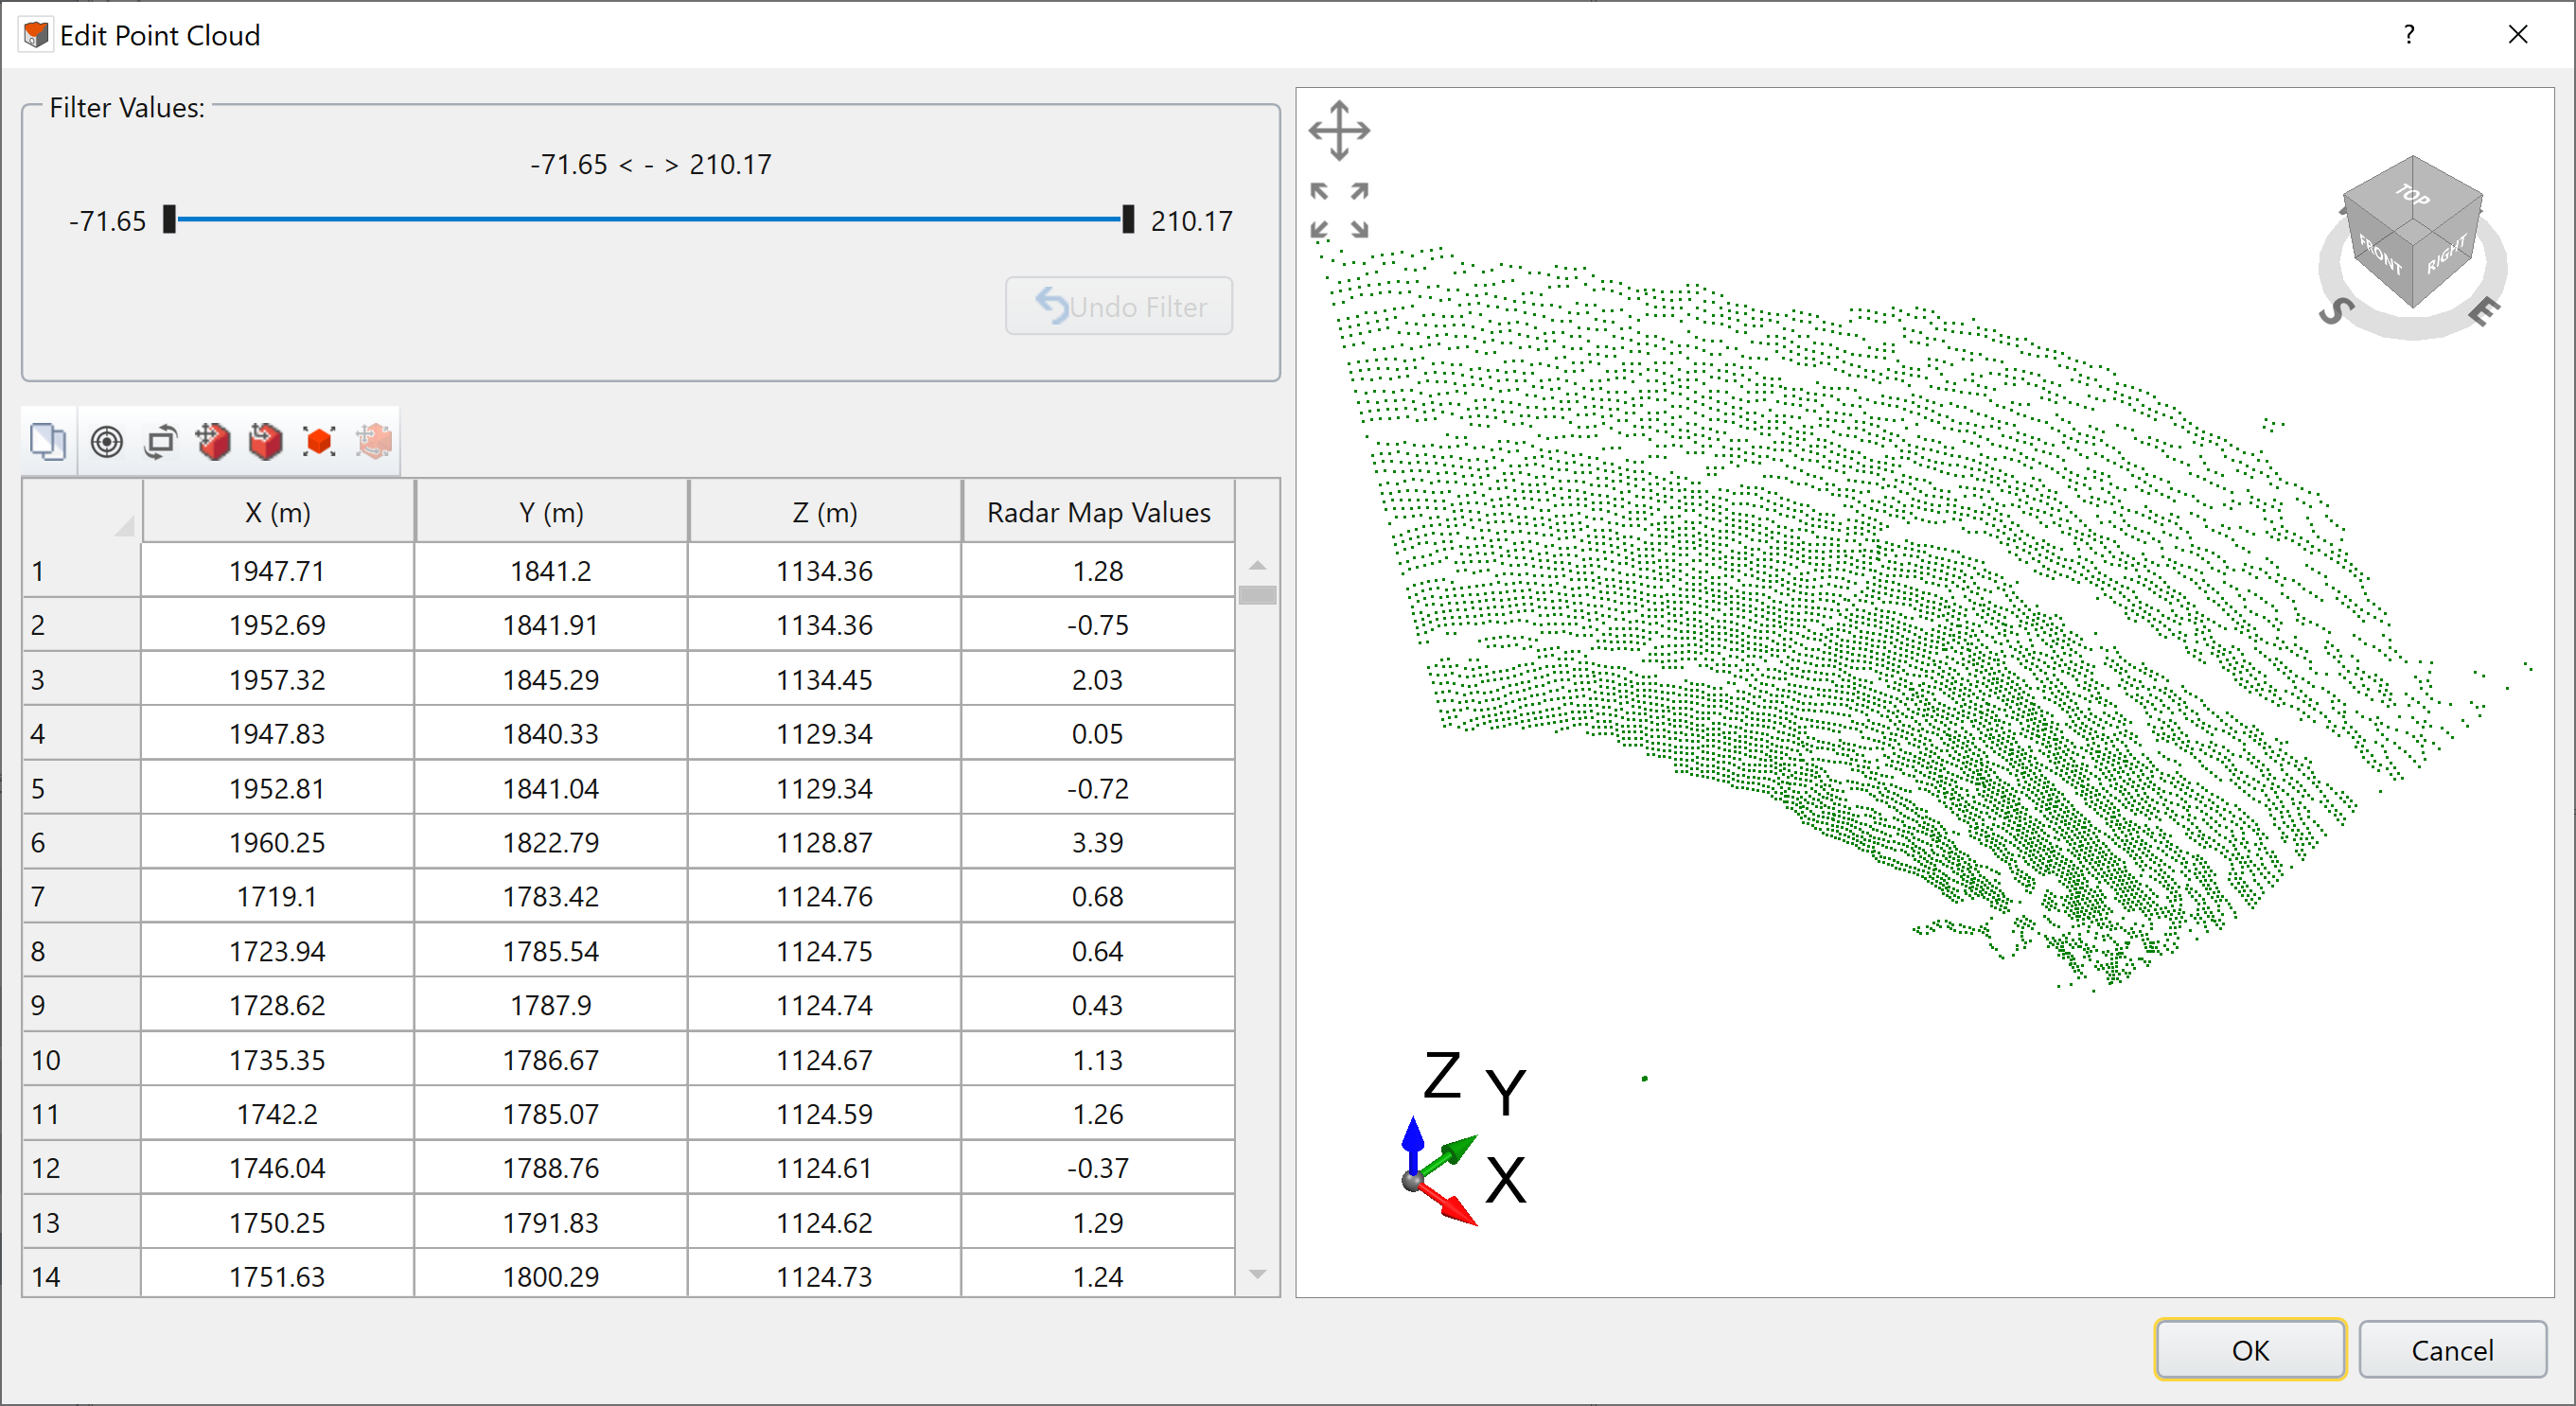
The Edit Point Cloud dialog will pop up. The user can now see a preview in the viewport on the right hand side of the dialog. An example dataset is shown below. You can use the viewport to rotate the model to
confirm that the geometry matches the project location.
The Filter Values section allows the user to customize the range of values they want displayed in the radar map. Moving the cursor will update the viewport with the data that falls within the customized range.
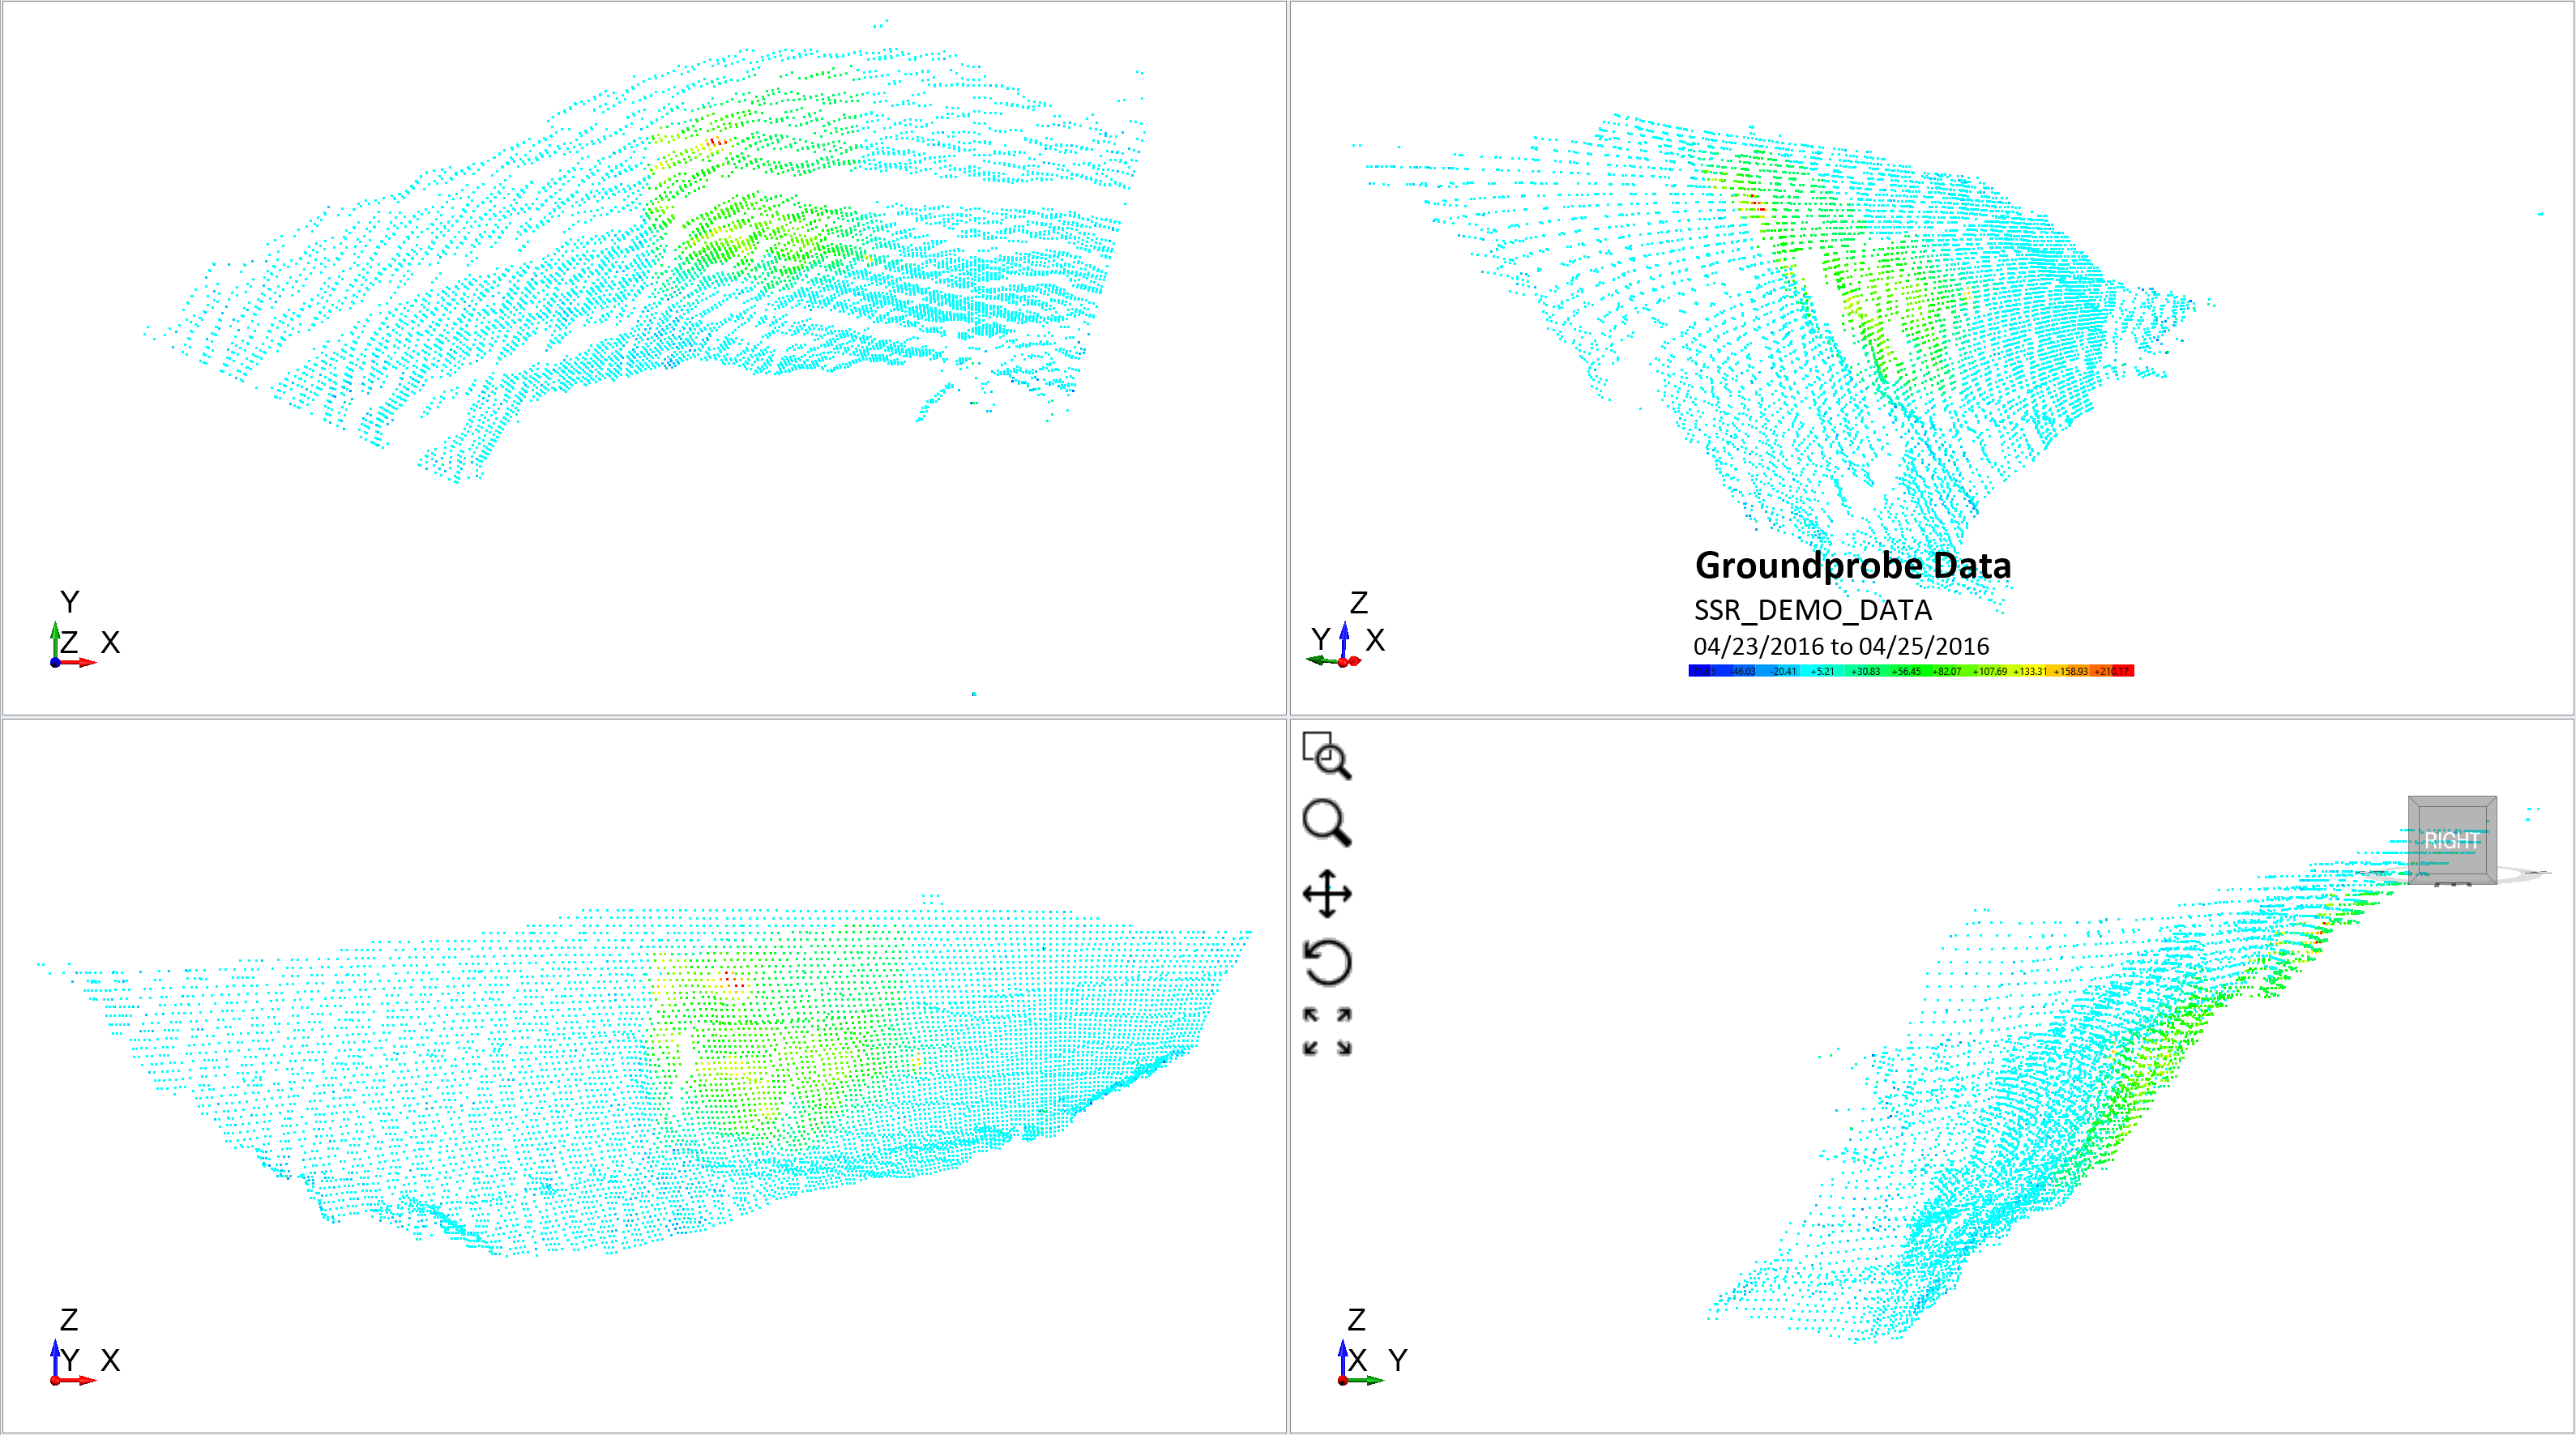
Select OK to create the map. An example of Groundprobe data for an open pit is shown below. The red and green regions indicate the highest displacements on this particular face of the open pit.