Import IDS Radar Data
Users can import data from radar systems manufactured by IDS GeoRadar which is used for the monitoring of slope displacements in open pit mines as well as
many other applications. The imported radar data is displayed alongside RS3 model results for easy comparison.
- Go to File > Import > Import Sensor Data > Import IDS Radar Data or Interpret > Import Sensor Data > Import IDS Radar Data
-
The Open File dialog will appear. After selecting the .csv4d file you wish to import, select OK.
Opening the .csv4d file of interest will prompt the Import CSV File dialog to open. The user can customize the method with which the program sorts through the data by selecting the type of Data Delimiter from the list below:
- Comma,
- Semi-Colon,
- Space,
- Tab,
- Pipe,
- All.
The user can also change the Start Row. The Data Value Enabled option allows the user to display data at each (X,Y,Z) coordinate. Some data imports only require coordinates while others like IDS radar data include a data value for each set of coordinates. The data can be anything, depending on the tool that uses the dialog. Even with the same manufacturer, like IDS, the data type can change (not just displacement), depending on what's in the file.
In the Data Column Selection section, the user can select which columns from the source file are displayed.
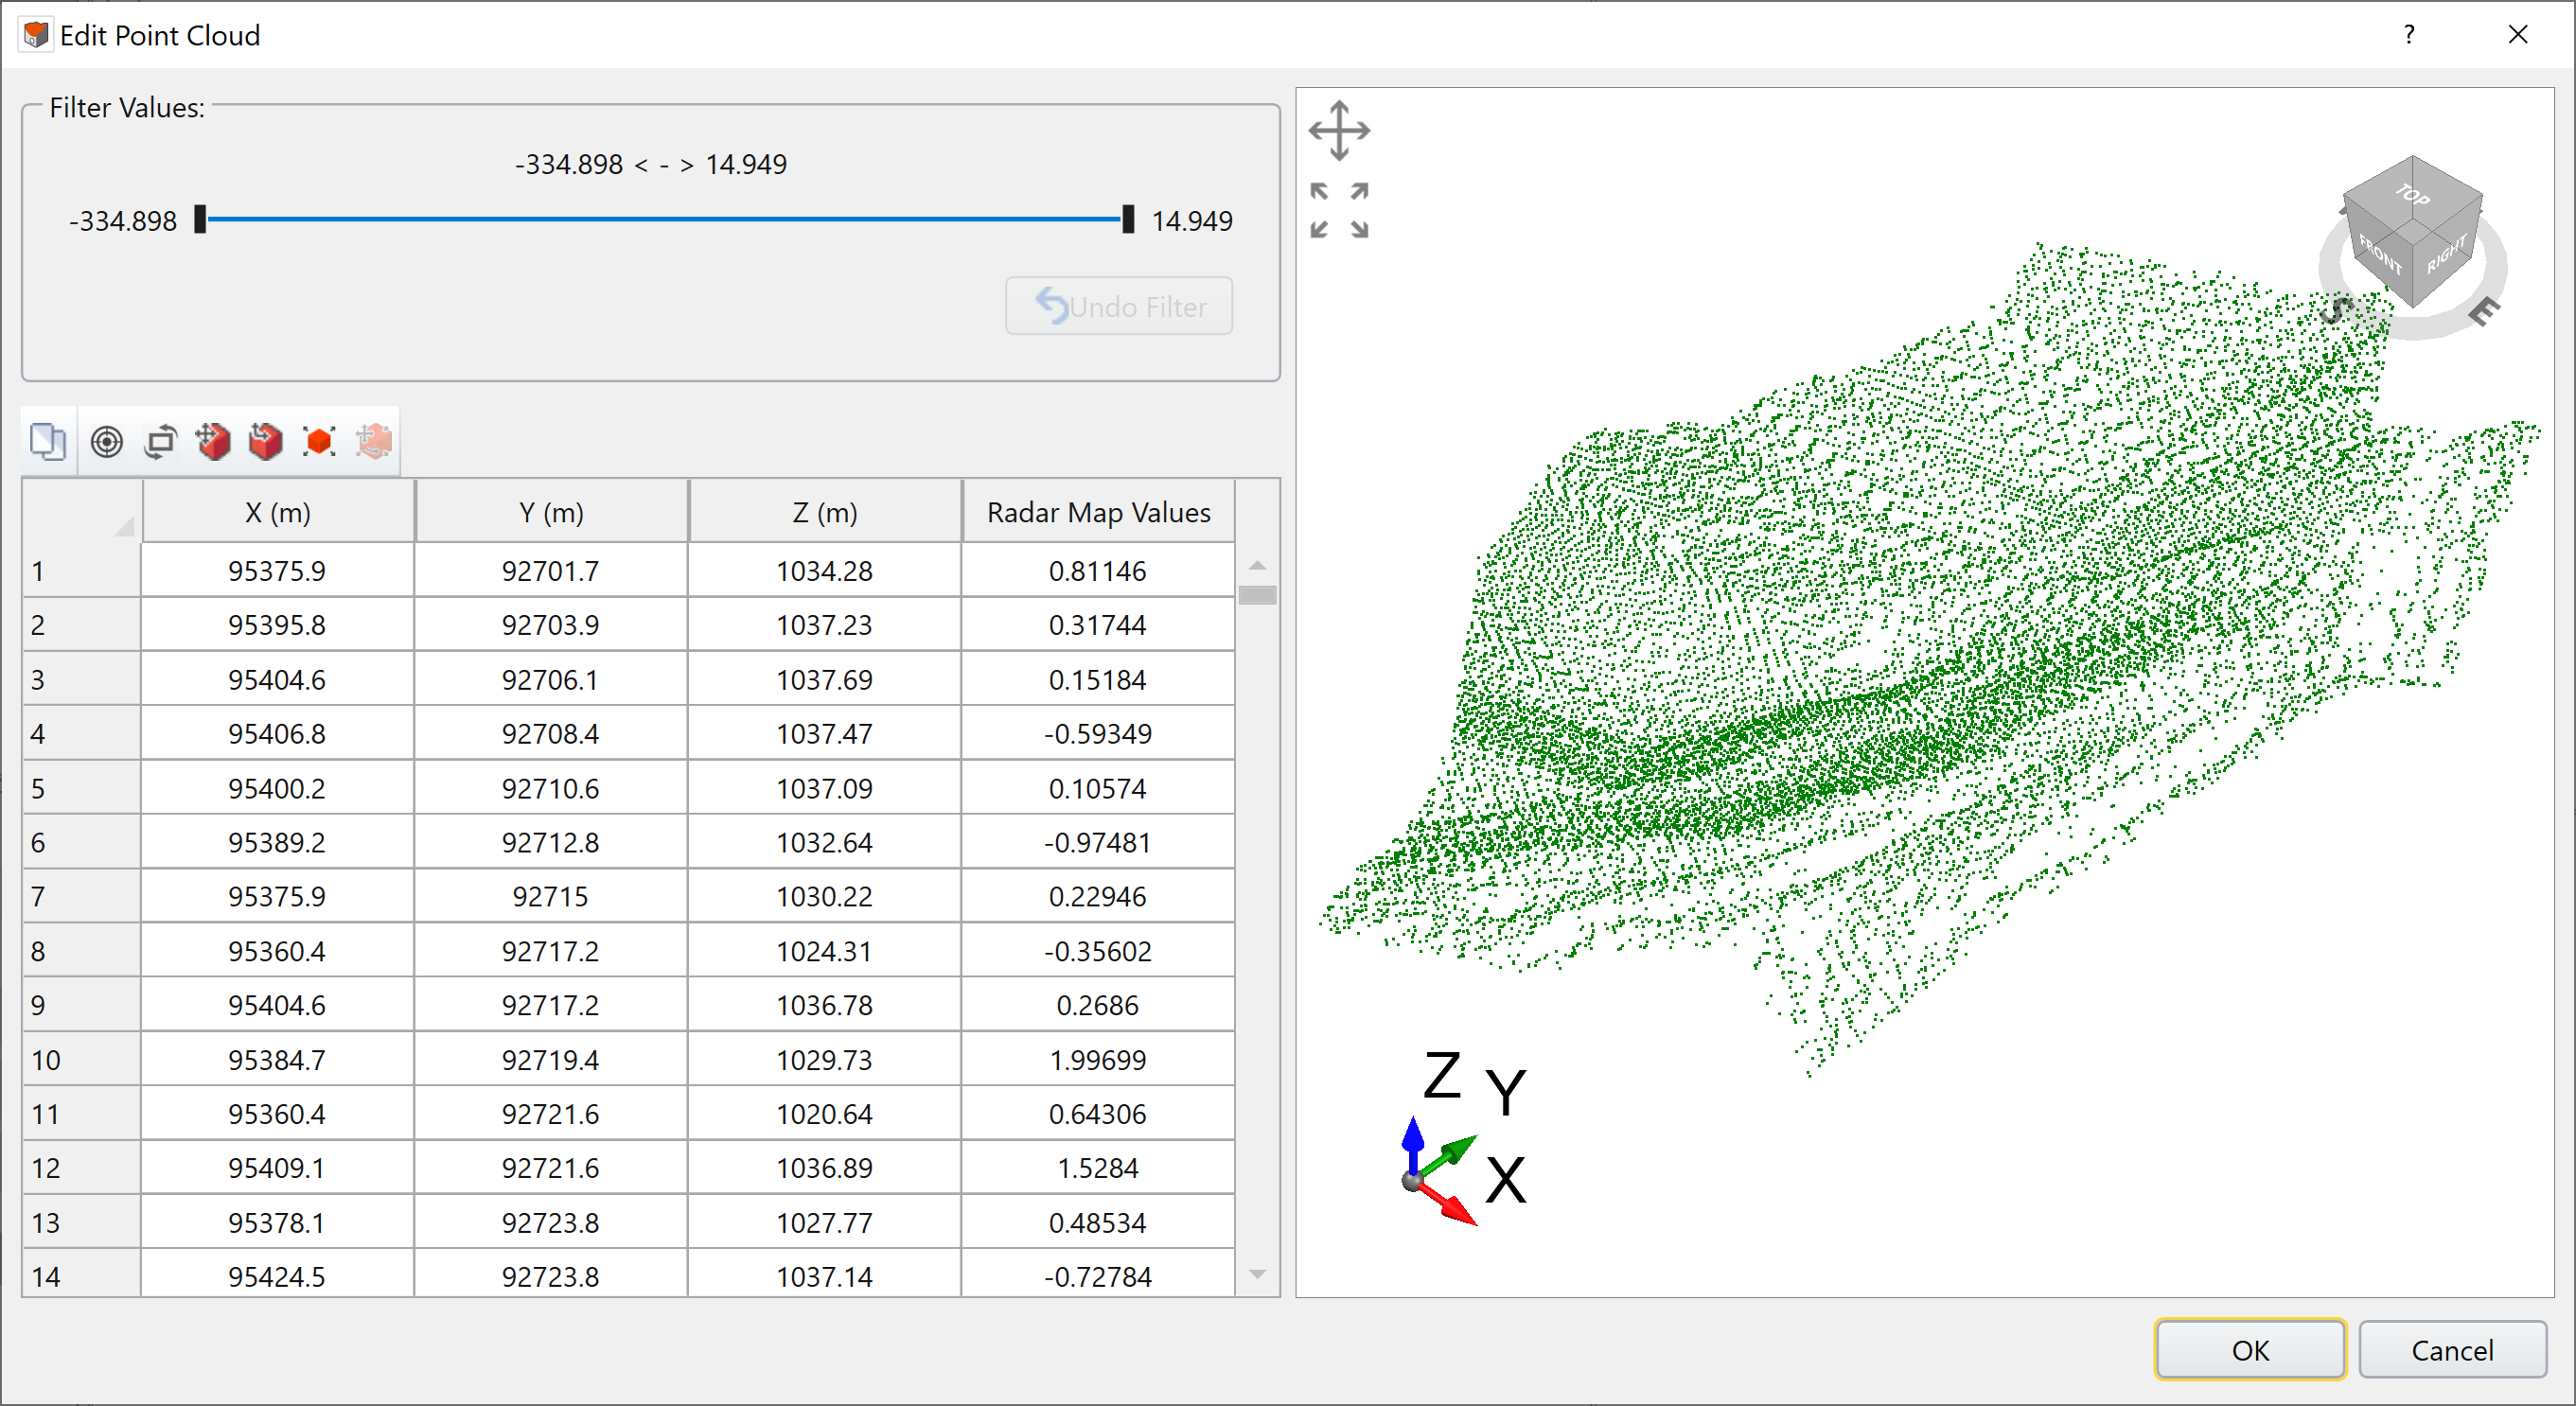
The Filter Values section allows the user to customize the range of values they want displayed in the radar map. Moving the cursor will update the viewport with the data that falls within the customized range.
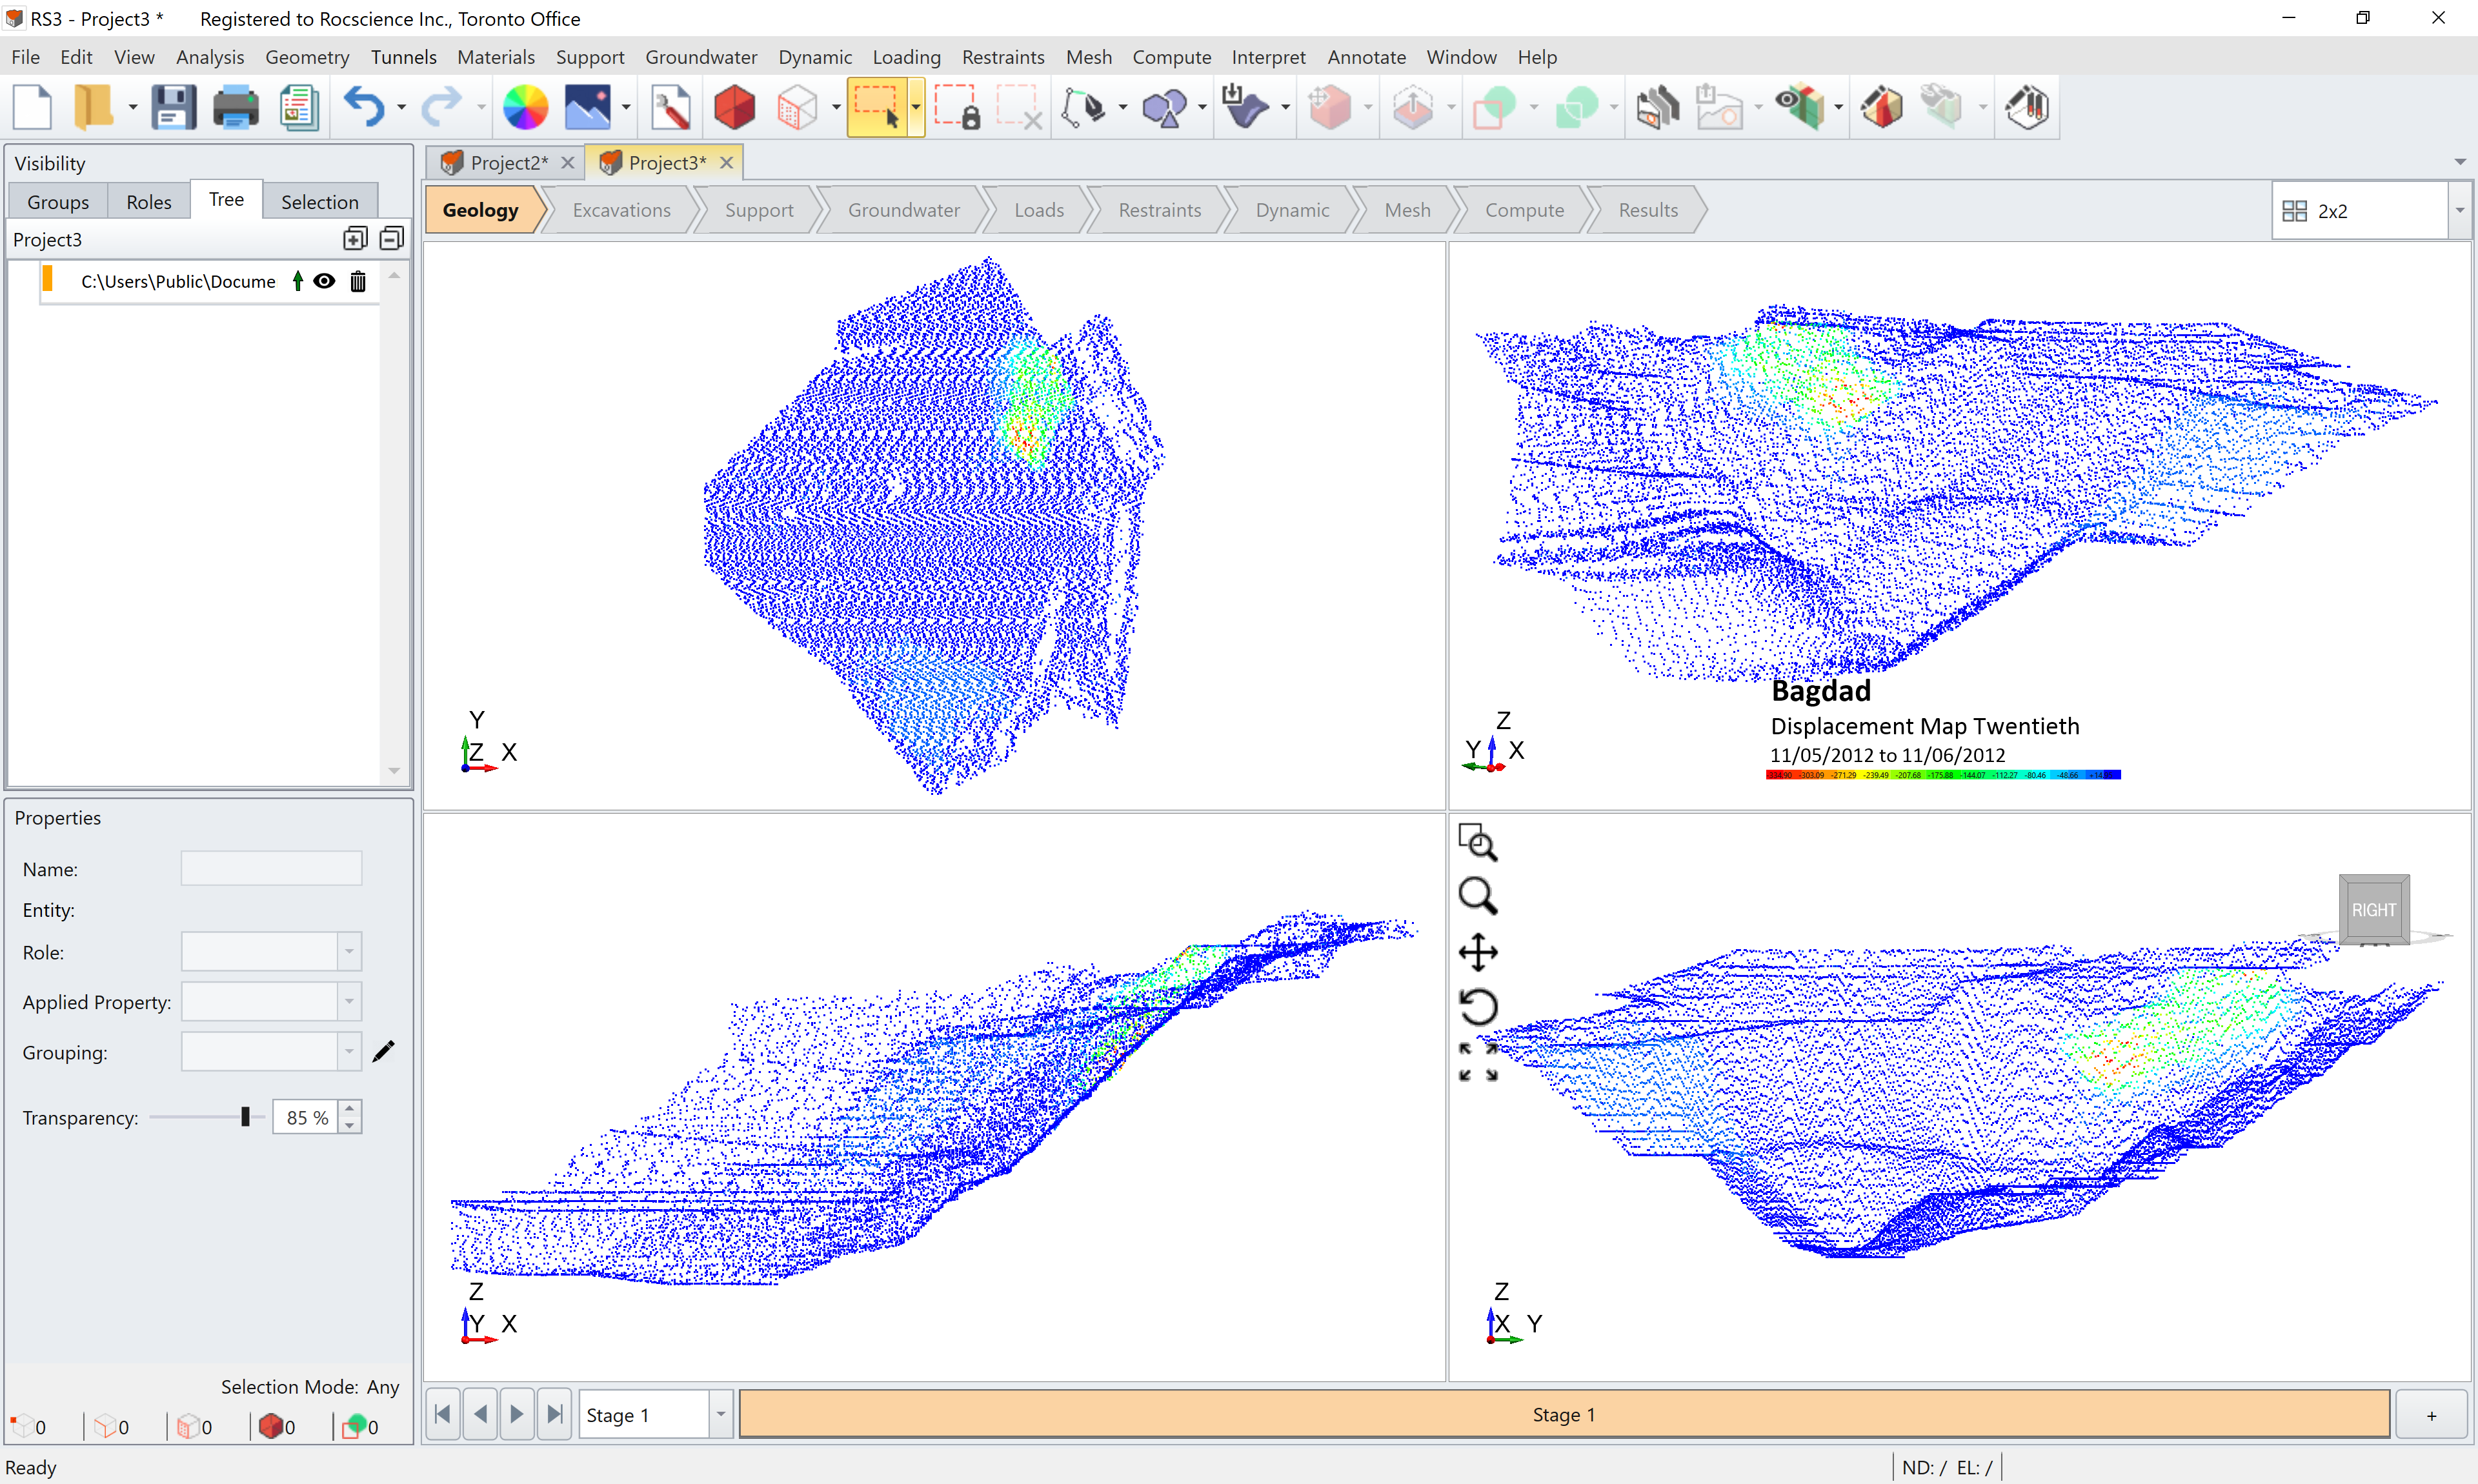
An example of IDS Radar Data import for an open pit is shown below. The yellow and red regions indicate the highest displacements in this open pit.