Region Detection
The Region Detection tool searches fully automated planar patches on the 3D model with user defined resolution and roughness. Detected regions are visualized colour coded on the 3D model giving an immediate impression of prevailing rock mass conditions. Extended tools as stereographic projections and clustering allows for identifying structures sets. By mouse click Areas are generated and closed polygonal lines follows the discontinuity surfaces providing properties like size, dip direction and dip angle, for each single measurement.
 icon at the left bottom in the Region Detection dialog.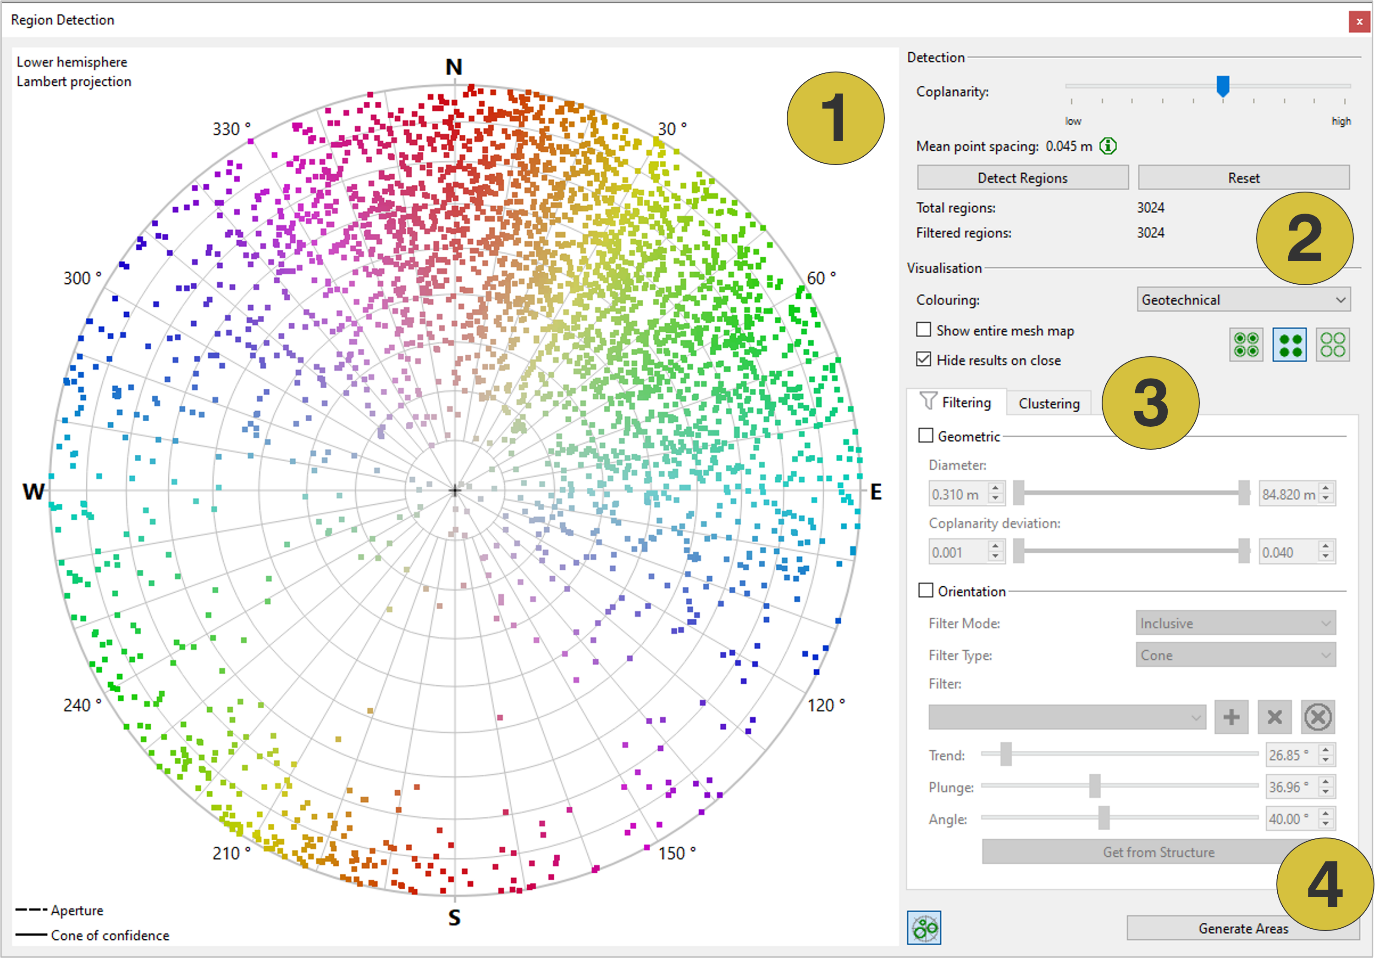
- Stereonet
- Settings
- Filters and cluster analysis
- Area generation
Standard operating procedure
- Click on the “Region Detection”
 icon in the toolbar of the Structure tab of the Mapping pane or chose “Window | Region Detection” in the menu bar and the Region Detection dialog appears
 - Set the Coplanarity slider to the desired position
- Check the displayed geometry quality of the 3D model by the given mean point spacing.
- Start the detection of regions by clicking the “Detect Regions” button
- Detected regions are immediately visualized colour coded on the 3D model and the poles of measured orientations plotted in the Stereonet.
- Optional, apply filter options and cluster analysis (see below)
- Click the “Generate Areas” button to generate area measurements
Features and options
- The Coplanarity controls how strictly regions must be planar to be detected. Moving the slider toward "low" allows rougher, less-planar surfaces to be grouped as regions. Moving it toward "high" requires surfaces to be more strictly coplanar to be detected.
 The Mean point spacing is related to the displayed geometry quality of the 3D model in the viewer. The Region Detection algorithm is based on the set resolution. It can be adapted in the menu Edit by adjusting the slider “Options | 3D View | Custom geometry quality”.
- Detect Regions runs the automated detection of planar patches
- Reset deletes results and restarts
- Total regions gives the number of regions detected
- Filtered regions gives the number of detected regions after filtering (see below)
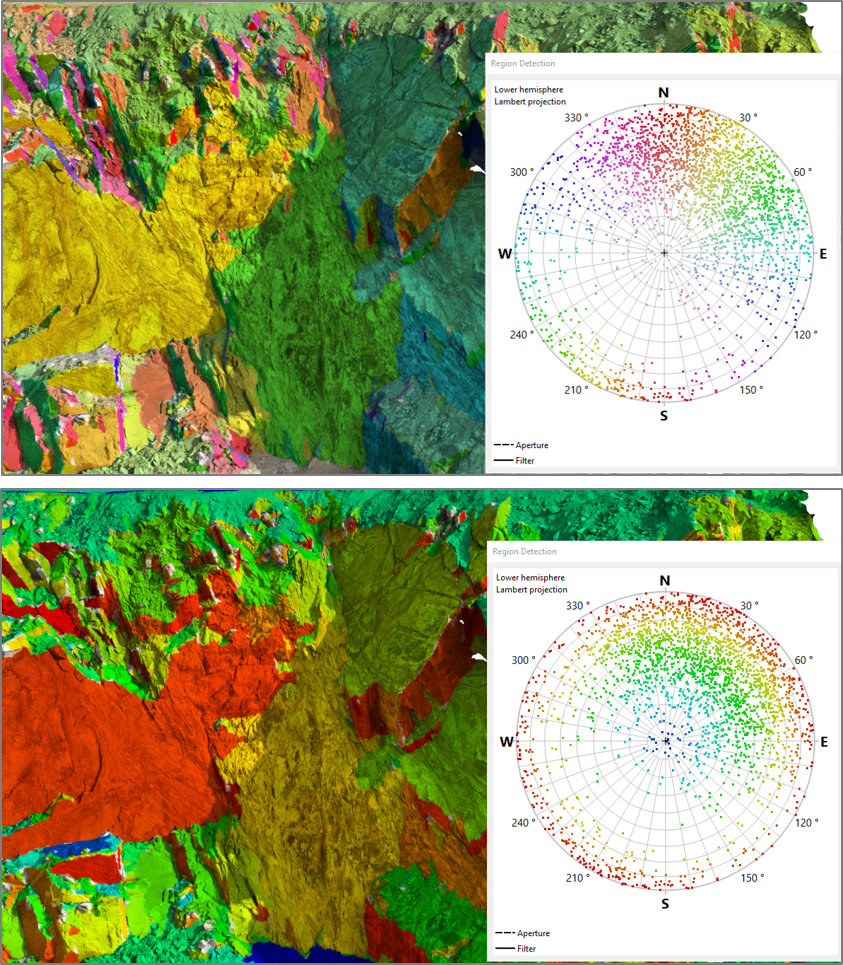
- Pull-down menu Colouring allows to change the colour coding. It is affecting the detected regions as well as the Stereonet. Three modes are provided:
- Geotechnical (mirrored colours)
- Inclination (continuous radial from blue to red)
- Inclination discrete (discrete radial from blue to red)
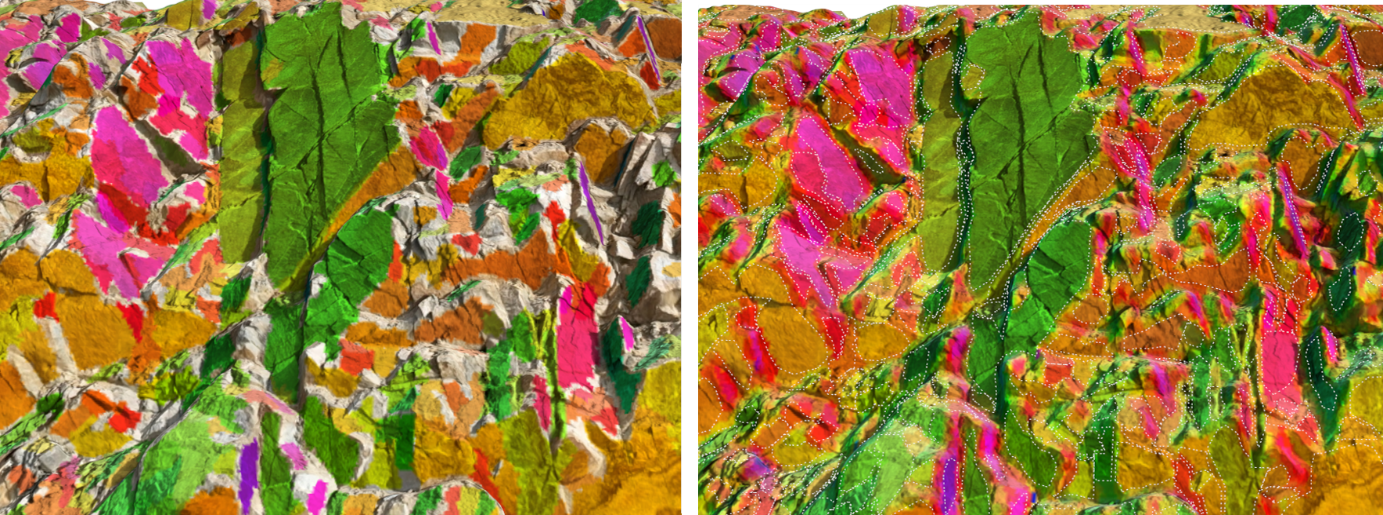
- Enabled checkbox Show entire mesh map: changes the colour overlay in the 3D viewer from detected regions only to a full colour overlay of the full mesh.
- Enabled checkbox Hide results on close: The colour coding on the 3D model is no longer displayed after closing the dialog.
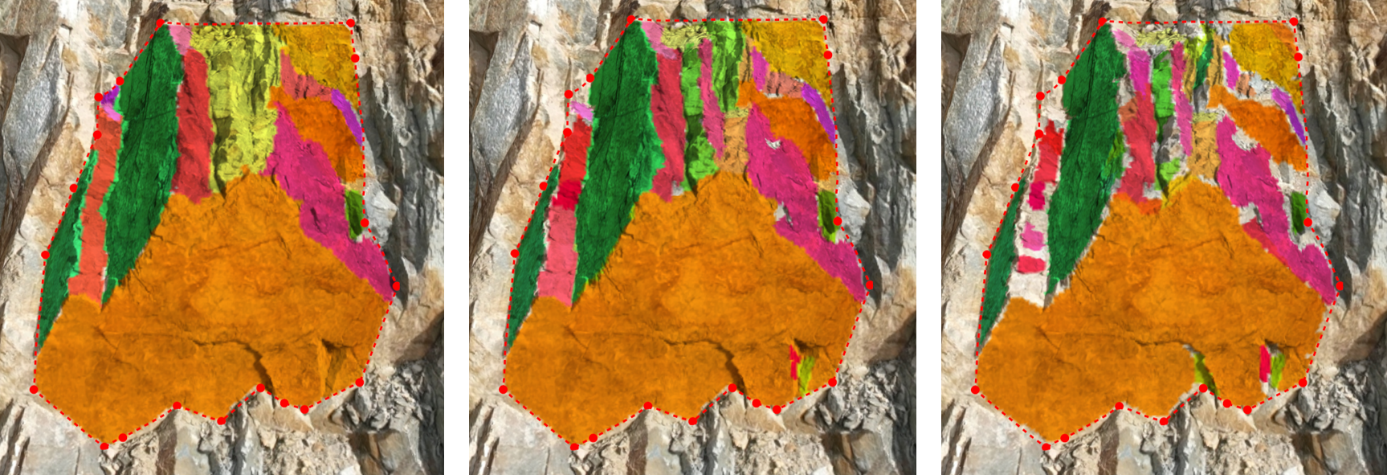
- Display modes of detected regions on the 3D model:
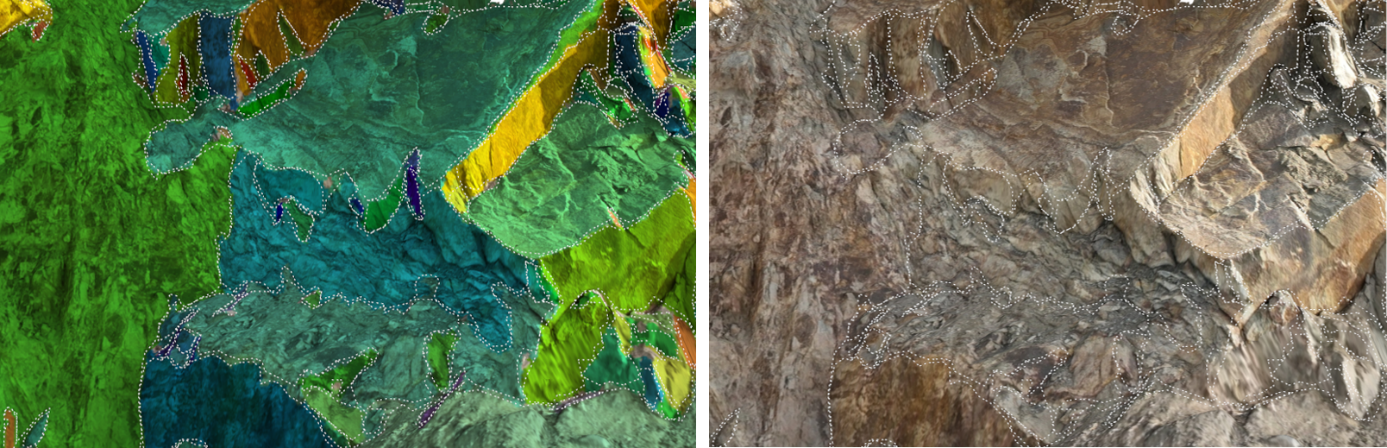
 Show Colours and Boundaries : show colour colour coding and borders (boundaries) of regions (areas) detected
 Show Colours: show colour colour coding of regions detected
 Show Boundaries: show borders (boundaries) of regions (areas) detected
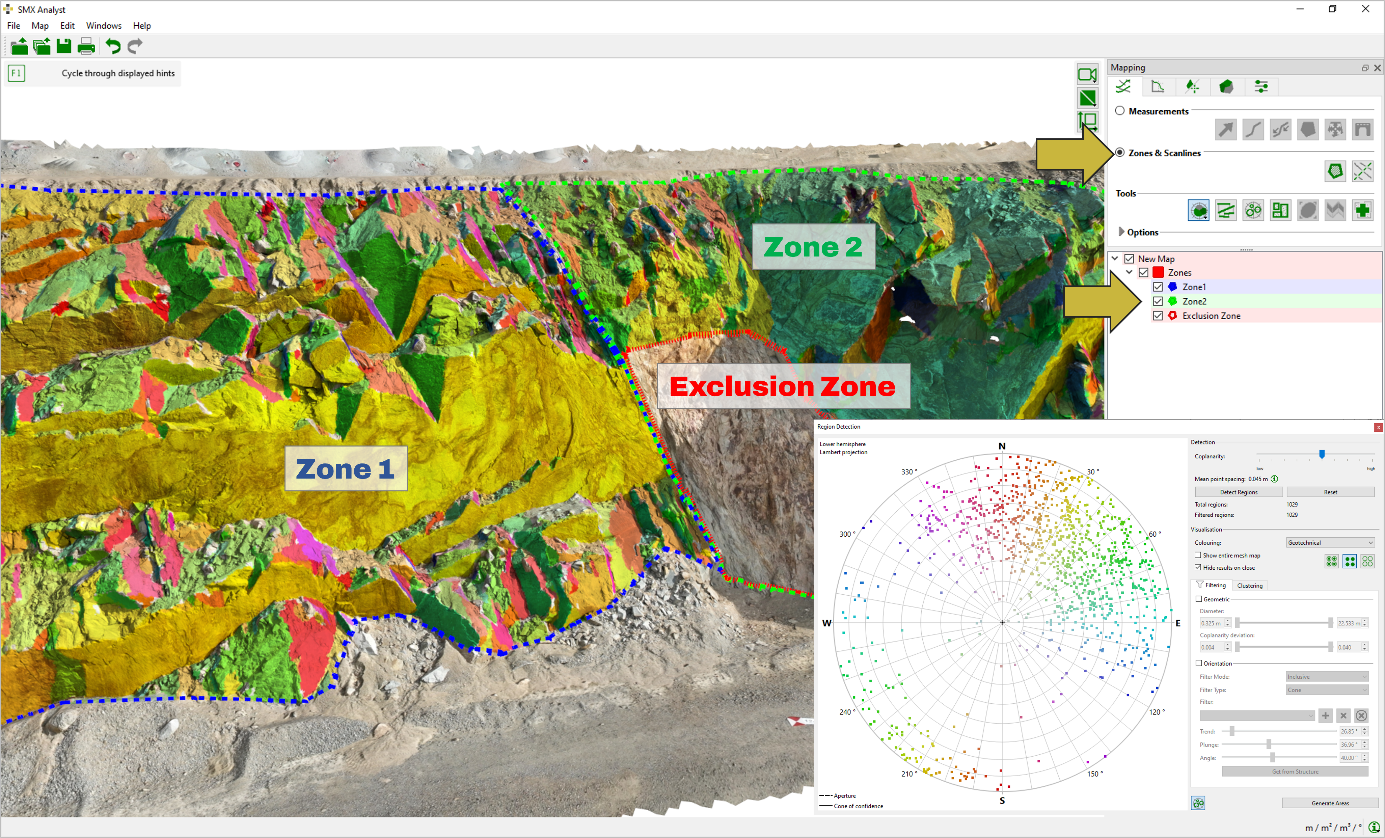
Analysis Zone(s)
The Region Detection is closely bonded to Zone(s) that are closed polygons drawn by the user on the 3D model which selects or excludes regions for analysis. Multiple Zones – analysis as well as exclusions zones can be outlined.
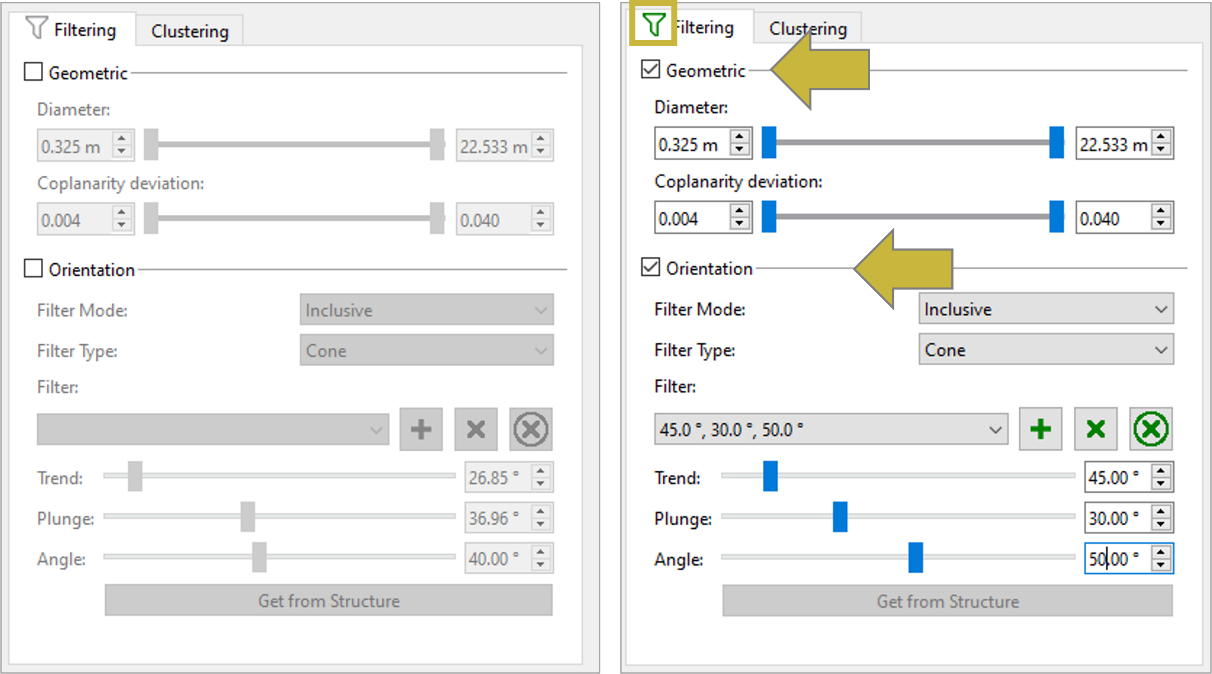
Filter options
Enabling of filters is done by clicking the checkbox “Geometric” or “Orientation” in the Filtering tab. As soon as filters are set and active, a “note” icon turns active too . This allows for an immediate control if the data in the Stereonet and displayed regions on the 3D model are filtered.
Geometric filter
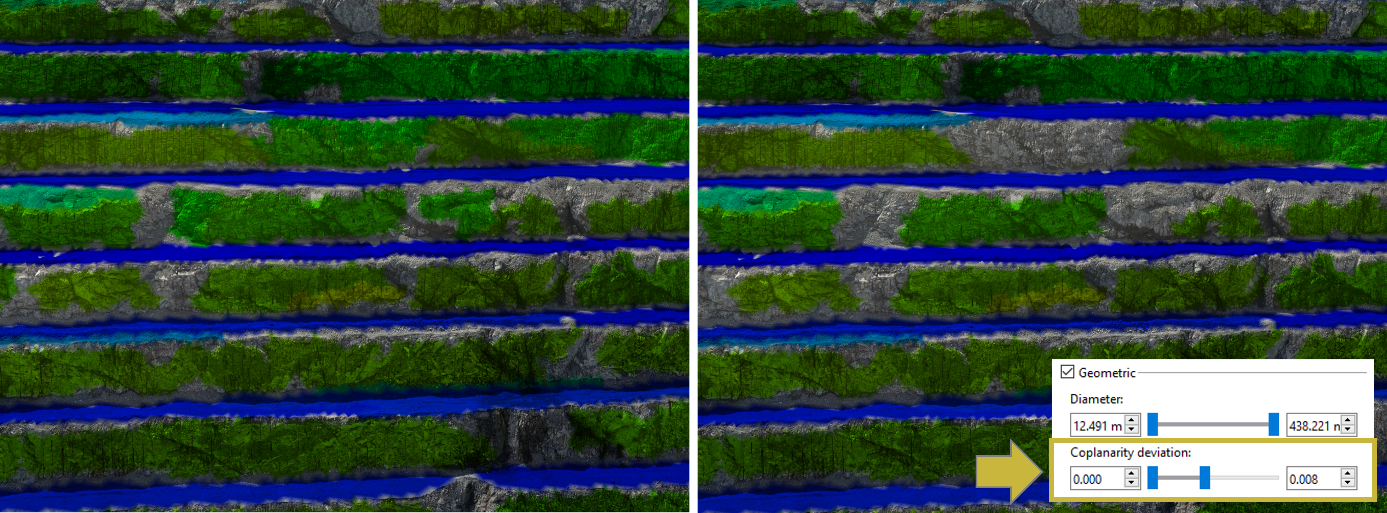
- Diameter (range sliders;): filters regions according to their maximum extension , i.e. diameter
- Coplanarity Deviation (range sliders;): allows to filter regions according to the Coplanarity Deviations for regions that is the diameter-weighted average distance of its surface from the best-fit plane. Regions with the smallest values are strictly coplanar whereas increasing values define rougher, less-planar surfaces.
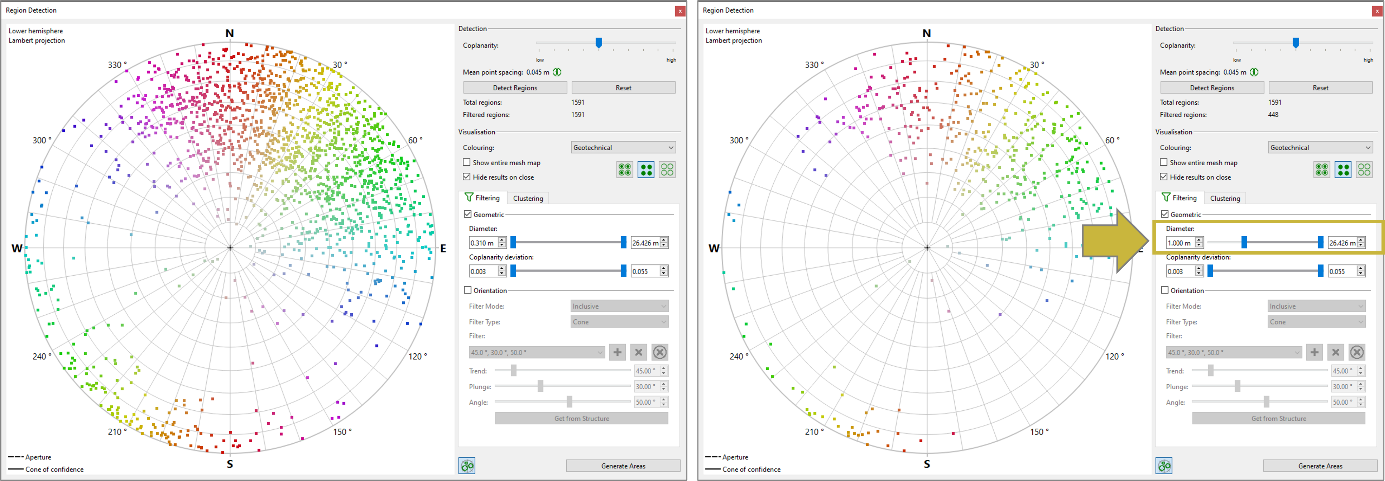
Geometric filter Diameter
Orientation filter
- Filter Mode (pull-down menu)
- Inclusive: regions in the entered range will be included
- Exclusive: regions in the entered range will be excluded
- Filter Type (pull-down menu)
- Cone
- Trend (range slider)
- Plunge (range slider)
- Angle (range slider)
- Range
- Dip direction (range sliders) + Offset
- Dip angle (range sliders)
- Multiple filters (available for Cone and Range filters)
- Add Filter

- Remove Filter

- Remove All Filters

- Add Filter
- Cone
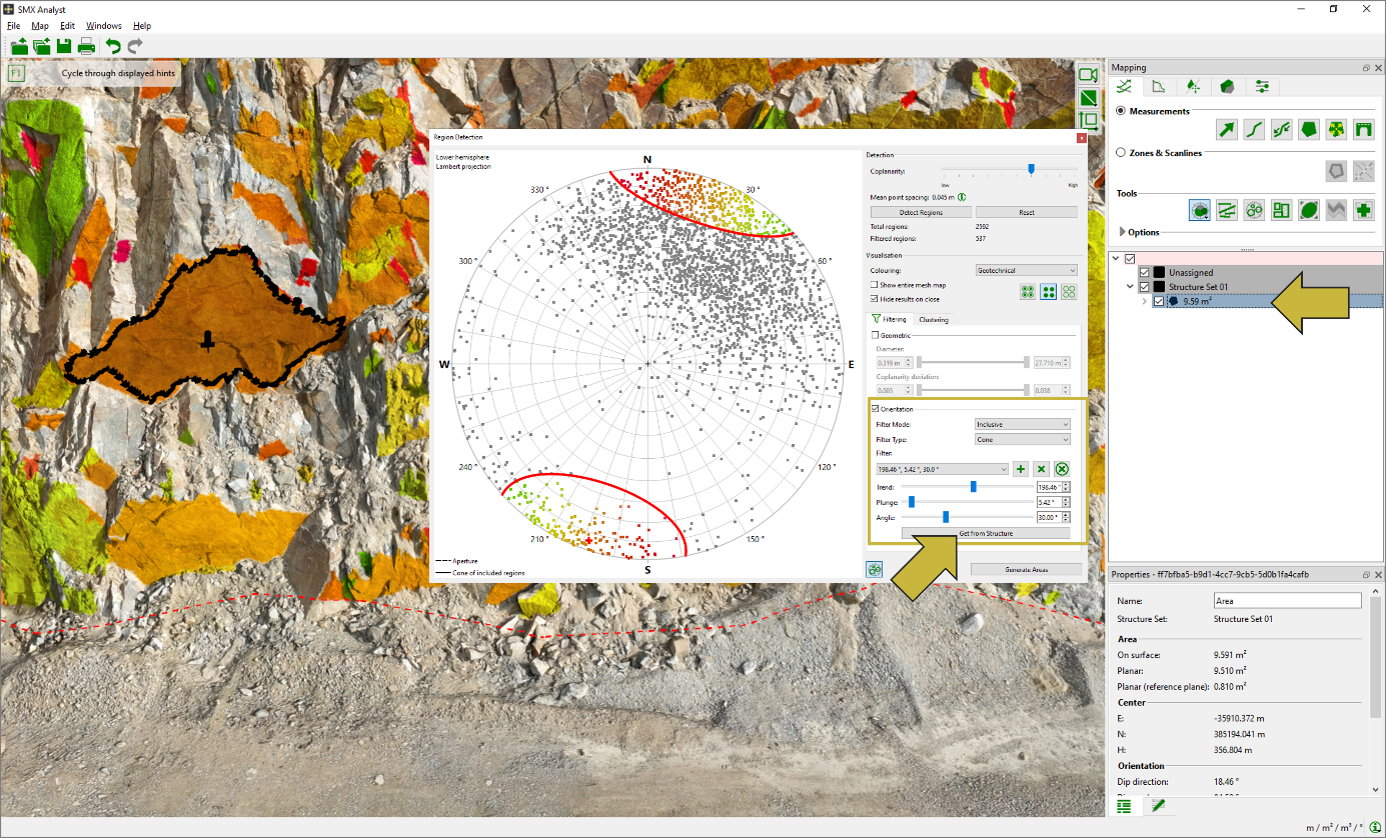
- Get from structure: defines the initial value (dip direction, dip angle) for the filter settings from a measured structure on the 3D model by the following procedure:
- Select a Structure Measurement (Orientation, Trace, Area) in the Structure Set or 3D model by clicking the mouse
- Click the “Get from Structure” button and the filter values are taken from the measurement
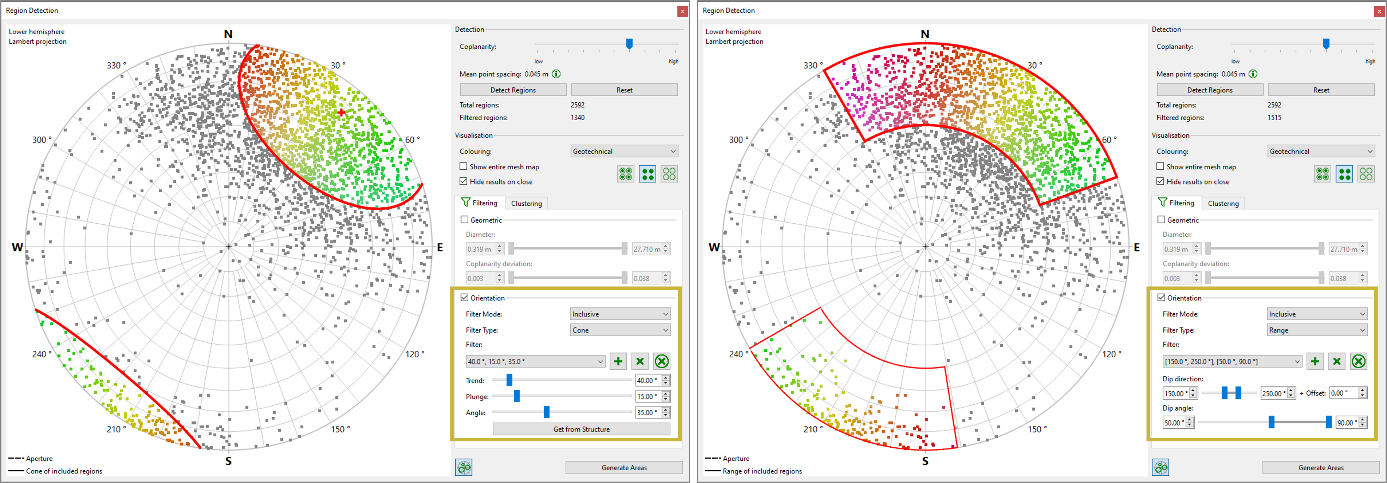
Cone filters (trend and plunge) can be defined by the user by clicking directly on the Stereonet.
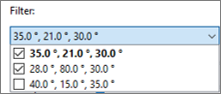
If multiple filters are set, they can be activated or deactivated individually by selecting the corresponding checkboxes:
Clusters
Joint Set Clustering is used to group measured structures automatically into Structure Sets. Clustering is based on a fuzzy K-means algorithm. Please refer to the Clustering topic for detailed information.
Membership angle: 90°
Confidence: 95%
Weighted by size: No
Any adaption of cluster parameters can be performed after Area generation in Clustering dialog;
Standard operating procedure
- Define the Cluster count that defines the number K of clusters. An upper and lower limit has to be defined. Only configurations within the defined bracket will be investigated.
- Click on the “Cluster Regions” button and clusters are determined
- Check the clustering result by inspecting the result for different clusters. You can switch between the results by selecting the corresponding number of clusters from the pull down menu.
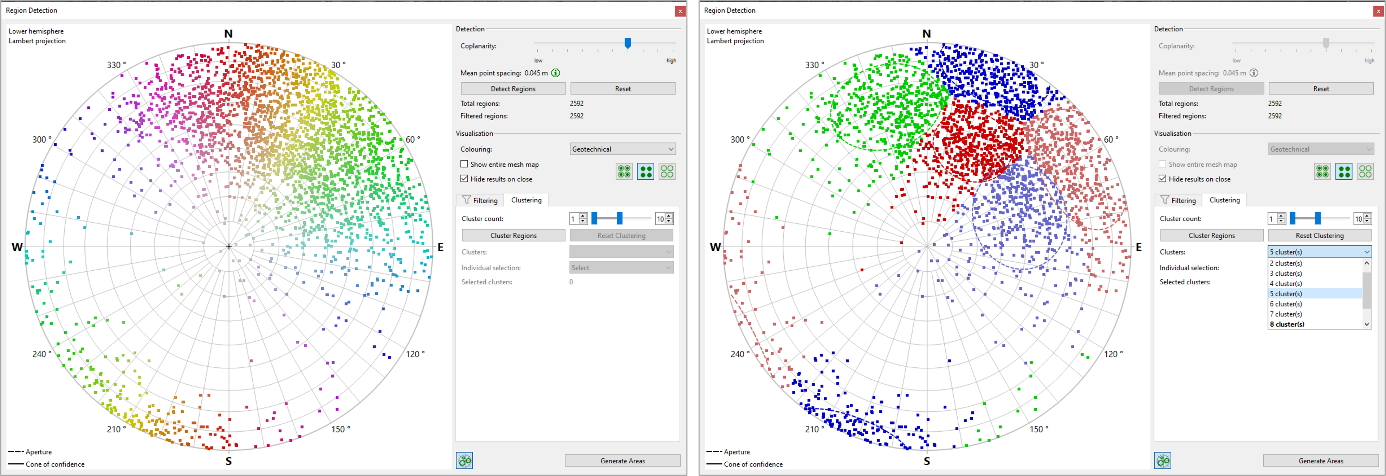
Individual Clusters can be excluded from the analysis in the pull-down menu “Individual Selection” by a click on the corresponding checkbox. See figure below.
Reset the Clustering by clicking the “Reset Clustering” button.