Contour Lines
The Analyst generates contour lines in respect to a user-definable projection plane (vertical, horizontal or general projection plane). Contour line properties are adjustable via the corresponding Contour Lines dialog.
Standard operating procedure
- Click on the “Contour Lines”
 icon in the toolbar of the Geometry tab of the Mapping pane
 - The Contour Lines dialog pops up showing the contour lines of the 3D model generated with the predefined settings. The dialog consists of the viewer, the Options side bar and buttons on the bottom right of the window.
The Options side bar offers the following functions:
- Range
- Start Level: Lowest level at which Contour Lines are generated. Note that the lowest level may be defined below the lowest 3D model level.
- Stop Level: Highest level at which Contour Lines are generated
- Step size: Defines the vertical spacing between the Contour Lines in the current unit
- Projection Plane
- General: generates contour lines in parallel to a user defined general plane with a user adjustable inclination and strike direction
- Vertical: generates contour lines parallel to a vertical plane with a user adjustable strike direction
- Horizontal: generates contour lines parallel to the ground plane of the 3D model
- Draw Bold Contours: Turns bold contour lines on and off. If they are turned on, you can define the interval between the bold contour lines using the “Every xxx Contours”.
- Filter Small Regions: Turning on this function ignores small areas showing closed contour lines especially at nearly flat regions.
- Show Scale Bar: Hide and shows the scale bar at the bottom left of the dialog
- Optimal Placement: Rotates the plan view in order to maximise the plotted size of the Contour Lines
- Simplification: Allows defining the degree of simplification by using the slider
- Plot
- Contour values - Properties of the elevation labels
- All: Label for every contour line
- Bold Contours: Labels only for bold contour lines
- None: No labels
- Contour values - Properties of the elevation labels
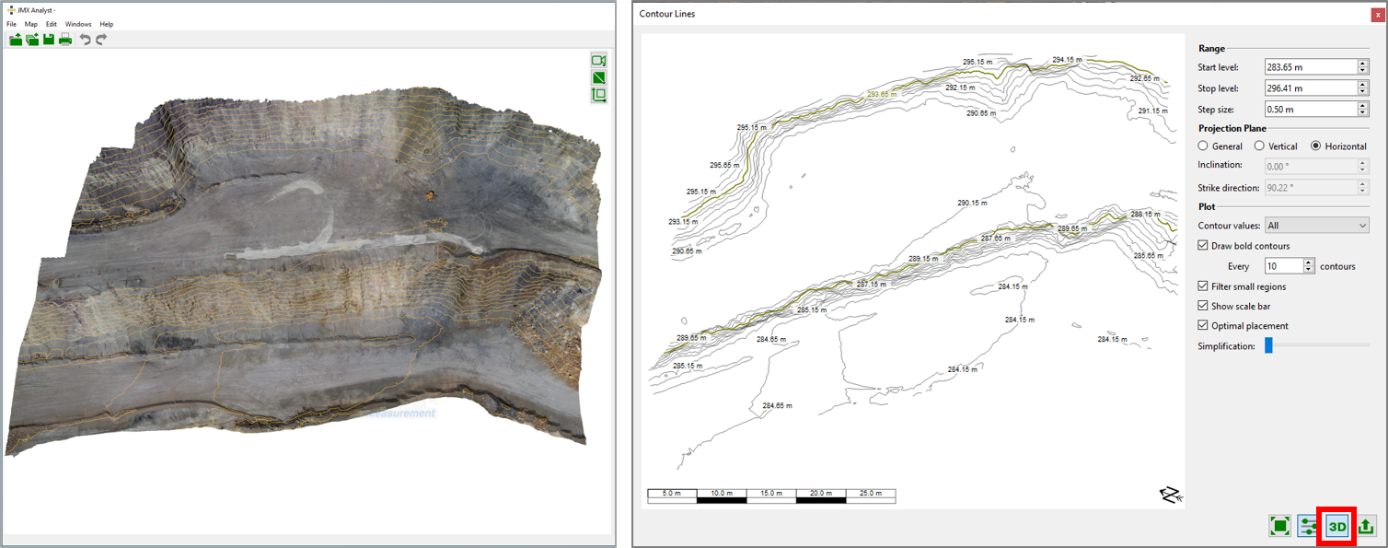
Any changes of the Contour Line dialog affects also the overlay on the 3D model if it is enabled with selecting “View | Show Contour Lines” from the menu bar or by clicking the button “Show in 3D Viewer” in the Contour Line dialog.
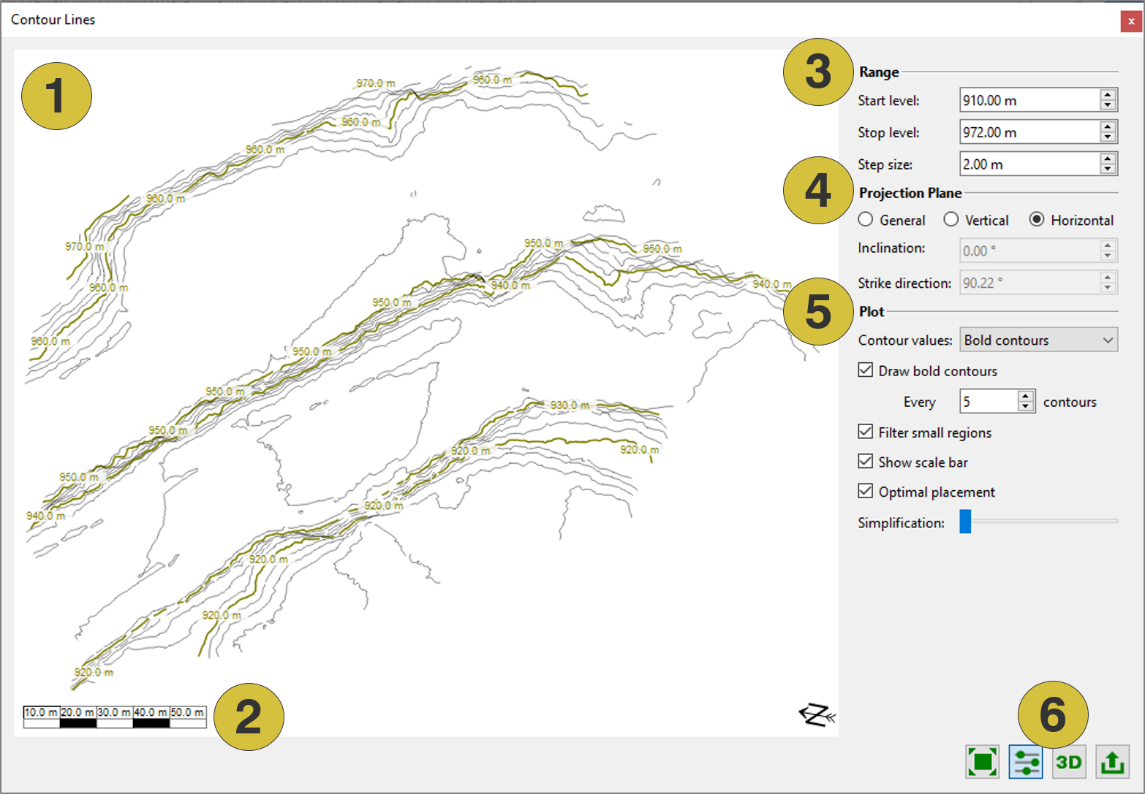
- Plan view
- Scale bar
- Range
- Projection plane
- Plot options
- Tool bar
Navigation
- Relocation is performed by moving the mouse keeping the middle mouse button pressed
- Zooming is performed by turning the wheel of the mouse
- Reset zoom: The full image is visualized again by clicking the “Reset Zoom”
 button or by selecting the command “View All” in the context menu of the dialog.
Toolbar
- Reset Zoom and Pan - Resets the zoom
- Options
 - Hides/Shows the options side bar
 - Show on 3D Model
 - Shows or hides contour lines on the 3D model
 - Export
 - Exports the contour line data as “.dxf” file
The plan view is saved as image (“.png” file) by clicking with the right mouse button somewhere in the viewer. A click on “Save as Image” opens a dialog to title the plot and to select the directory so save on the computer.