Lithologic Region
Analyst provides partitioning and quantification of user defined areas (Lithologic Regions and Homogenous Areas) on the 3D model.
Lithologic Region
The feature Lithologic Region allows to define different rock types on the 3D model. A Lithologic Region is an area which is split up into several segments each corresponding to a specific rock type. The region and its segments are delineated by polygons on the 3D model. Once a Lithologic Region is confirmed, the total area and the area of the particular segments in m2 and the relative area in percentage is calculated. The segments can be assigned to individual rock types in the software. Rock types (name and colour) have to be defined in the Mapping Definition File (“.pb” file) created in the Start Window Settings dialog launched from the center window of ShapeMetriX (see corresponding user manual).
Procedure: Step 1 – Add Lithologic Regions
- Click on the “Lithologic Region”
 icon in the toolbar of the Area Partitioning tab or use the shortcut key “L”.
 - Mark the border line of the Lithologic Region (entire region) on the 3D model by clicking the left mouse button. A polygonal line grows instantaneously.
- Confirm the polygon by pressing the “Enter” key or the “Space” button. The area is automatically closed.
- Split the area into segments by drawing:
- A polygon, which intersect the border of the Lithologic Region
- A closed polygon inside the border of the Lithologic Region
- Go on splitting the Lithologic Region until all segments have been defined.
- Finish the Lithologic Region by pressing the “ESC”, “Enter” key or “Space” button.
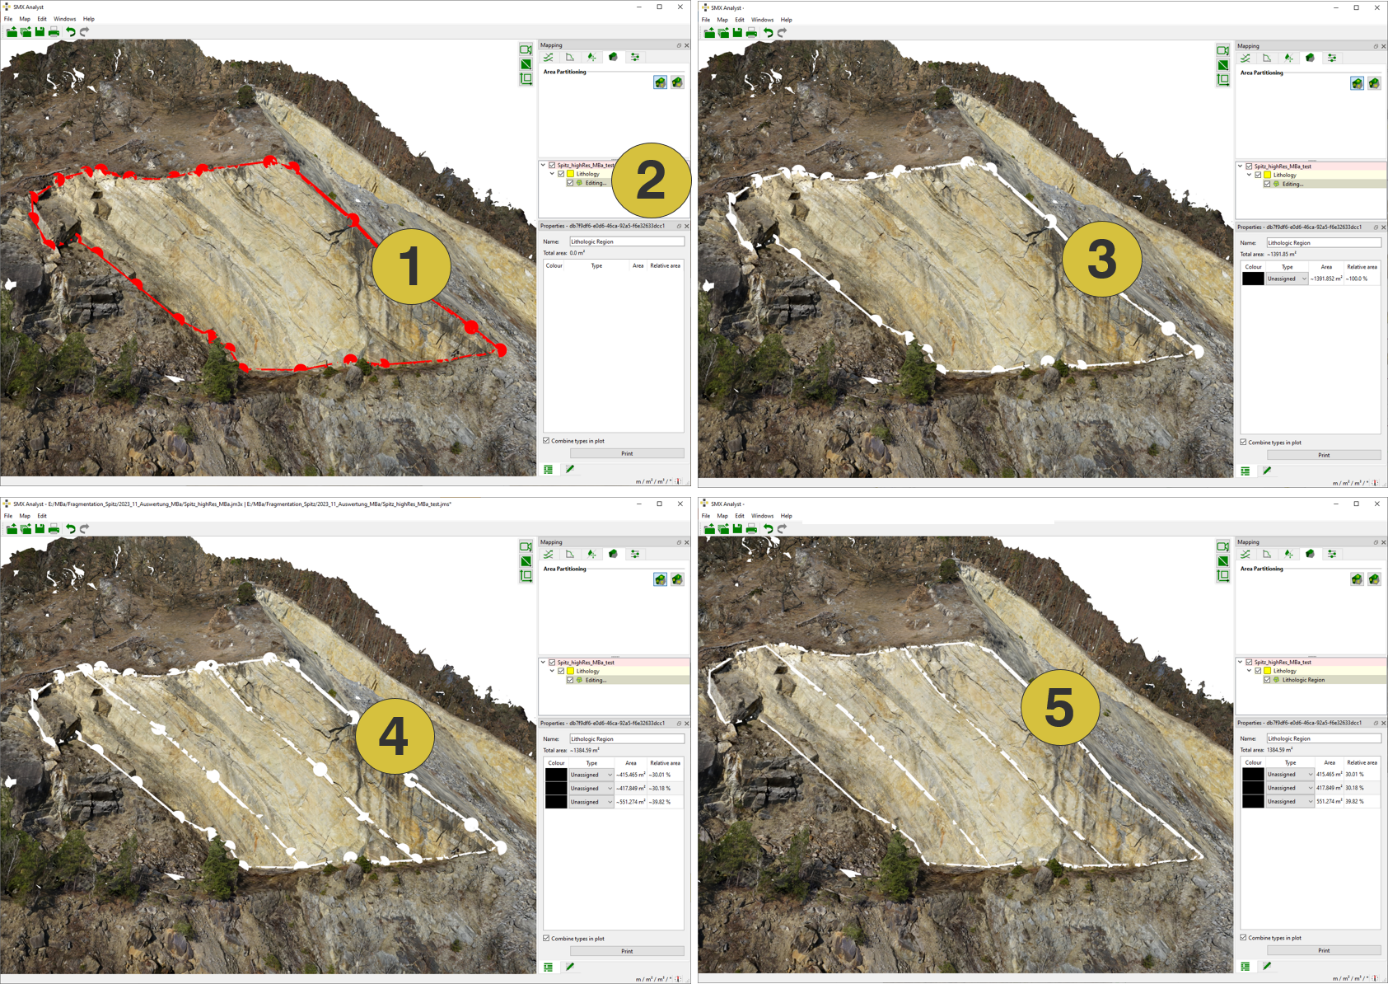
- Drawing the border line of the Lithologic Region
- Lithologic Region in the Geometry tab
- Confirmed border line
- Splitting up the area into segments
- Confirmed Lithologic Region
Procedure: Step 2 – Assign rock types to Lithologic Regions
- Open the Properties pane for Lithologic Regions (if not already activated) by a click on “Windows | Properties” in the menu bar or in the context menu “Show Properties”.
- Choose the segment by a click on the corresponding area. The active area is highlighted in the 3D model (thick line) as well as in the Properties pane (bold letters).
- Choose the rock type in the pull-down menu next to the calculated area values (total areas in m3 and relative areas in percentage) in the Properties pane. The area is re-coloured immediately in the 3D viewer after choosing the rock type.
- Go on assigning the individual segments by repeating steps 8 and 9.
The Lithologic Region is displayed in form of a pie chart in the Plot dialog. Areas of equal rock types are combined in the plot by enabling the checkbox “Combine types in plot” in the Properties pane. Notification to each segment is gained by moving the cursor on it. The pane is activated in the context menu “Show Plot” or by a click on “Windows | Plot” in the menu bar.
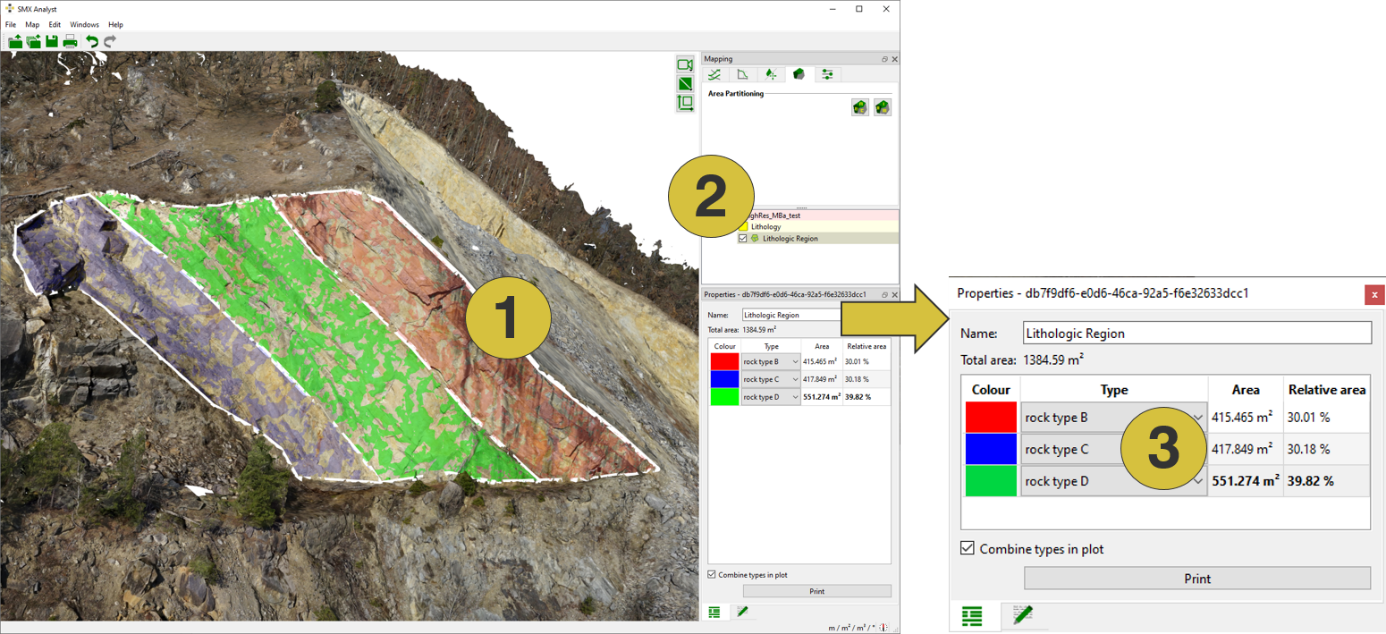
- Selection of segment (highlighted in the 3D viewer and in the Properties pane)
- Name of the Lithologic Region (editable) in the Properties pane
- Assignment of rock types from the pull down menu in the Properties pane
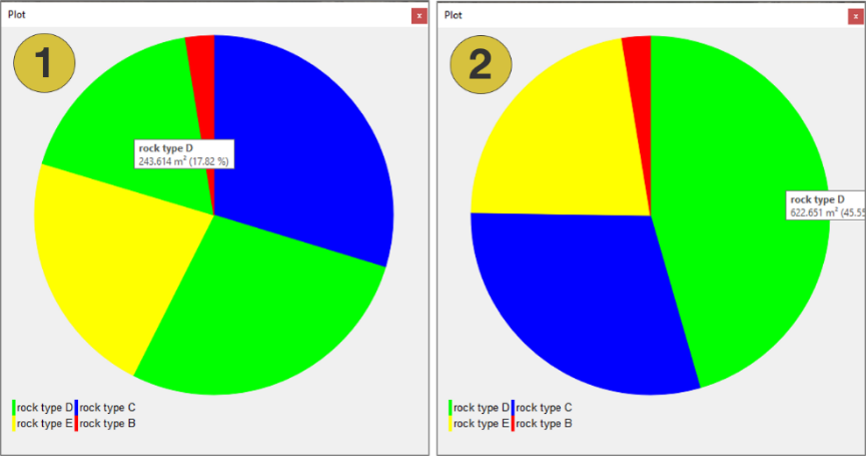
- Pie chart of the Lithologic Region
- Pie chart of the Lithologic Region with rock types combined
Context menu
- Edit
Enters a new segment - Active
Activates (shows) and deactivates (hides) the selected item - Look at
Centers the Lithologic Region in the 3D viewer - Look at and Zoom
Centers and zoom the Lithologic Region in the 3D viewer - Delete
Deletes the selected Lithologic Region - Show properties
Opens the Properties pane for the Lithologic Region - Export
- Export Area Partitioning Data as CSV - Exports the Lithologic Region as “.csv” file
- Export as DXF - Exports the data as ”.dxf” file
- Export as VRML - Exports the data as ”.vrml” file