Clustering
Automatic joint set Clustering is used to group measured structures automatically into Structure Sets. Clustering is based on a fuzzy K-means algorithm. It aims to minimising the distance measures between mean values of the Structure Sets and the individual measurements (objective function). The implementation within the Analyst considers orientations of measurements of structures (Orientations, Traces and Areas). Thus, the implementation minimises the angles between the mean orientation and the individual orientations within a Structure Set. It uses a random set of initial values.
A fuzzy K-means algorithm requires a predefined number of clusters in which the data set shall be grouped. It iteratively recalculates the mean orientations and regroups the data set based on the current distance measures. The solution corresponds to the minimum value of the objective function obtained from a variation of initial values. The optimum number of clusters is a priori not known. Hence the fuzzy K-means algorithm is executed several times with a different number K of predefined clusters. In order to judge the optimum number of clusters a partitioning criterion is applied. The result with the optimum partitioning is suggested. Other results can be displayed on user interaction. The partitioning criterion examines the angular distance between all possible pairs of cluster mean orientations. If the angle exceeds the vector sum of the spherical aperture plus the cone of confidence of each set, the partitioning is counted as statistically significant. The result with the optimum partitioning has a maximum of significantly separated pairs, normalised by the compared number of pairs.
Standard operating procedure
- Click on the “Clustering”
 icon in the toolbar of the Structure tab of the Mapping pane or chose “Window | Stereonet Analysis” in the menu bar
 - The Clustering dialog appears which shows the poles of the measured Orientations discriminated for each Structure Set together with the cone of confidence and the spherical aperture. Typically, the map comprises only one Structure Set before clustering.
- Define the configuration of Clustering:
- Cluster count: Defines the number K of clusters. An upper and lower limit has to be defined. Only configurations within the defined bracket will be investigated.
- Membership angle: Defines a limit beyond which an Orientation is no longer considered to be within the cluster
- Confidence: Influences the size of the cone of confidence and affects the statistical cluster separation
- Weight Orientations by size: Analyst allows to enable weights for each measurements. The weights are related to the maximum diameter of the structure. In consequence, large structures have more impact on the mean set orientation than small structures. The mean orientation vector of a Structure Set is then the sum of all weighted Orientation measurements contained in the Structure Set. “Weight Orientations by size” is enabled by ticking the corresponding checkbox.
- Click on the “Cluster” button and clusters are determined
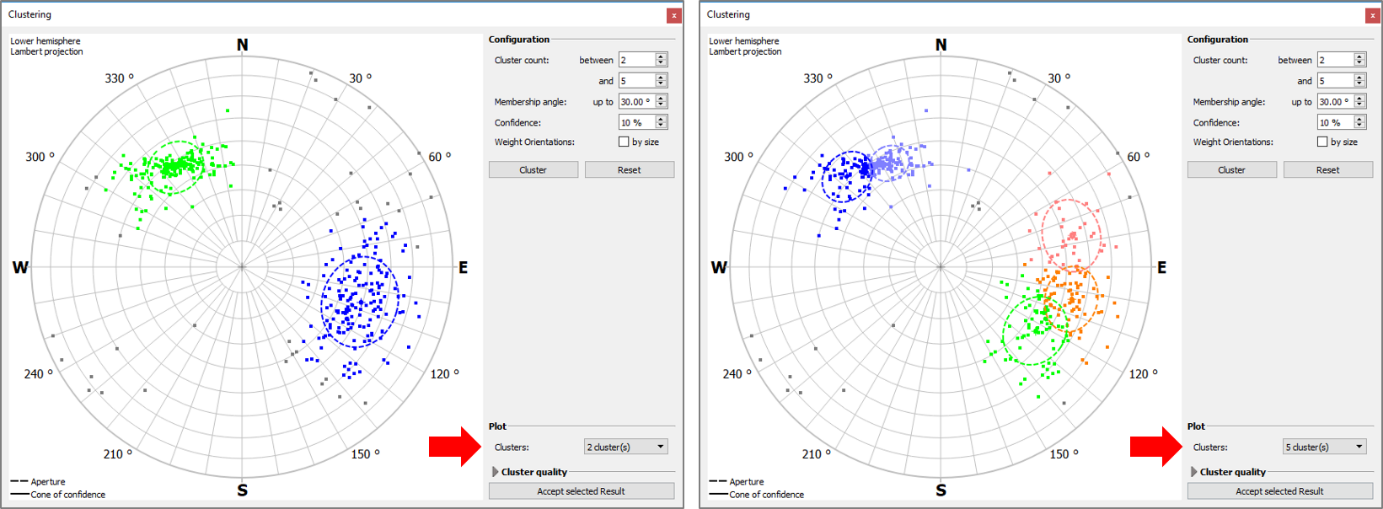
- Check the clustering result by inspecting the result for different clusters. You can switch between the results by selecting the corresponding number of clusters from the pull down menu. The Cluster Quality Measures help in judging the optimum cluster configuration.
- Confirm result by clicking on the “Accept selected Result” button or reset the Clustering by clicking the “Reset” button
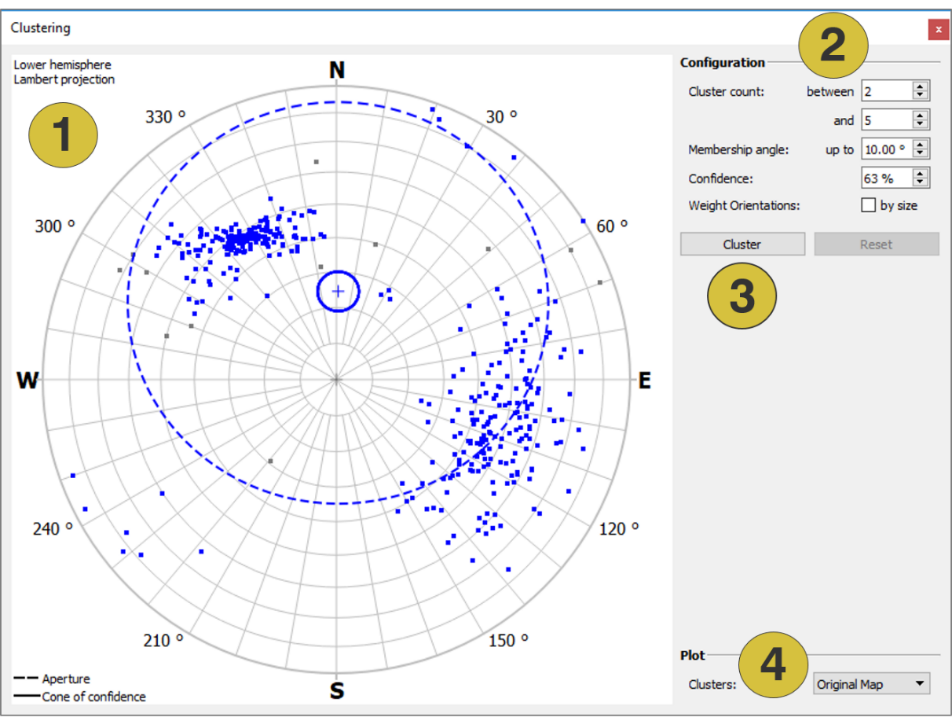
- Projection of the lower hemisphere
- Configuration
- Cluster
- View results
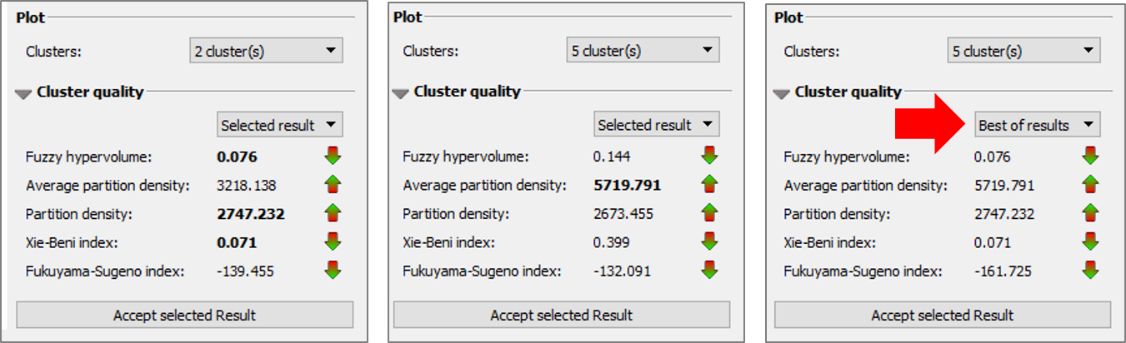
The quality of Clustering is reviewed by following Cluster Quality Measures:
- Fuzzy Hypervolume (min): Clusters shall occupy a minimum of the parameter space. The value shall be minimal.
- Average Partition Density (max): Poles shall be well-concentrated around the mean set orientation. The value shall be maximal.
- Partition Density (max): Poles shall be well-concentrated around the mean set orientation. The value shall be maximal.
- Xie-Beni Index (min): Tests the overall compactness and cluster separation. The value shall be minimal.
- Fukuyama-Sugeno Index (min): Relates the values of the fuzzy cluster objective function with the “cost” of increasing the numbers of clusters. The value shall be minimal.
Based in the provided information the user can judge the results and choose the optimum clustering result. Further reading for clustering background:
- Hammah, R. & Curran, J. (1998). Fuzzy Cluster Algorithm for the Automatic Identification of Joint Sets. Int. J. Rock Mech. Min. Sci. 35(7), 889-905.
- Wallbrecher, E. 1986. Tektonische und gefügeanalytische Arbeitsweisen, Enke, Stuttgart, 244pp
The hemispherical plot is saved as image (“.png” file) by clicking with the right mouse button somewhere in the viewer. A click on “Save as Image” opens a dialog to title the plot and to select the directory so save on the computer.
After the first clustering of a Structure Set, a so-called Unassigned Set, is added to the Structure List. The Unassigned Set contains Annotation Elements without an Orientation. Consequently the Unassigned Set does not provide any Orientation Statistics. The following Annotation Elements are assigned to the Unassigned Set:
- Areas without orientation
- Traces without orientation
- Tape
- Bridges
- Measuring Points
- Outliers
Usually, each Annotation Elements with an Orientation is assigned to a cluster. Outliers are filtered by defining the maximum membership angle. The “maximum membership angle” defines a limit beyond which a measurement is no longer considered to be within the cluster and assigned to the Unassigned Set.