Hints
General
- Measurements are listed in the individual Structure Sets corresponding to their order in the toolbar, i.e. Orientation, Trace, Area and Bridge. Discontinuity Models are listed at the end.
- Annotation Elements are selected by clicking them either in the 3D viewer or within the individual lists. Selected elements are highlighted in both areas. Multiple selection of Annotation Elements is performed by holding “Ctrl” and clicking the left mouse button on the desired items. Multiple selection is possible within lists as well as in the 3D viewer.
- Customized notes are added to each Annotation Element by opening the Notes
 tab in the Properties pane.
 - The current sub mode, i.e. Annotation Element, is terminated and a new one of the same type is started by pressing the “Space” key.
- A shortcut key function is assigned to each Annotation Element e.g. O for Orientation, T for Trace.
- Notification to each icon is gained by moving the cursor on its entry in toolbar.
- Notification to each Annotation Element in the 3D viewer is gained by holding “Shift” and moving the cursor on the item.
- The context menu of individual Annotation Elements is called by selecting the desired item followed by a click on the right mouse button.
- By default, the Structure Set and the Annotation Elements assigned are pointed out in the same colour in the Structure List as well as on the 3D model in the viewer. However, the colour of each element can be changed individually in the context menu by the user. The same may apply to all lists and corresponding elements in the Analyst interface.
- Orientations and Discontinuities are automatically added to (Guided) Traces and Areas after first editing by enabling the appropriate checkboxes in the Settings tab (Mapping pane).
- A new Structure Set is added to the Structure List by clicking “Add Structure Set”
 in the toolbar of the Structure tab of the Mapping pane.
 - The default Map colour is defined in the general Options dialog called via the menu “Edit | Options”.
- The size and the shape of the panes can be adjusted with the mouse. Undocked panes can be placed on different screens. The layout of the user interface can be reset with selecting the menu “Window | Reset Layout”. The viewer and the panes are arranged to its original layout.
Set colour
Individual colours can be defined for Annotation Elements in the context menu by clicking “Set Colour”. The Colour dialog comprises a table showing basic colours, a table for custom colours (usually empty at the beginning), a colour mix field, a brightness bar, an editable colour value field and a display of the current colour. Confirming with the “Ok” button assigns the current colour to the individual item. The colour can be chosen from the basic colour table or can be customised. For customised colours use the colour mix field and the brightness bar by the use of the left mouse button. Alternatively, custom colours can be defined using the HSV and RGB editable fields. RGB refers to Red-Green-Blue values and can take values between 0 and 255. HSV refers to Hue-Saturation values. Hue can take values between 0 and 365 while the saturation and brightness can take values between 0 and 255. For further details refer to literature. The current colour can be copied to the custom colour table by clicking the “Add to Custom Colour” button.
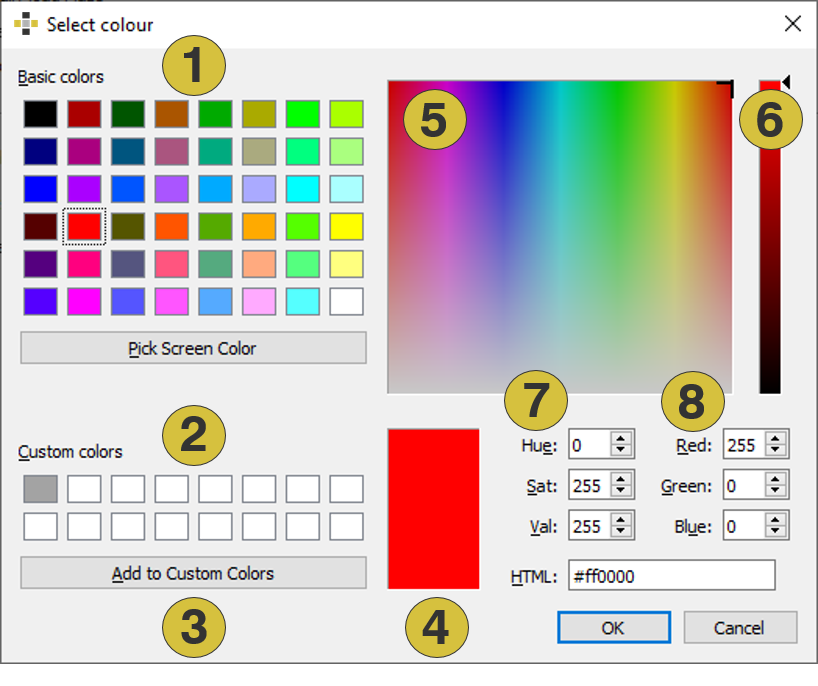
- Basic colours
- Custom colours
- Add current colour
- Current colour
- Colour mix field
- Brightness bar
- HSV colour data (editable)
- RGB colour data (editable)