CSV 4D / Radar Data
CSV 4D allows to import movement data from a “.csv” file provided from the Guardian software (IDS GeoRadar). The import includes co-ordinates of a point cloud with corresponding displacement data achieved from radar systems. A false colour overlay visualizes the displacement in the 3D viewer and the corresponding legend illustrates the steps of the displacement from blue to red. The feature offers the possibility to visualize geologic data along with radar data to help identifying mechanism that causes the displacement. CSV 4D is activated by a click on the “CSV 4D”  icon in the toolbar of the Geometry tab (Mapping pane).
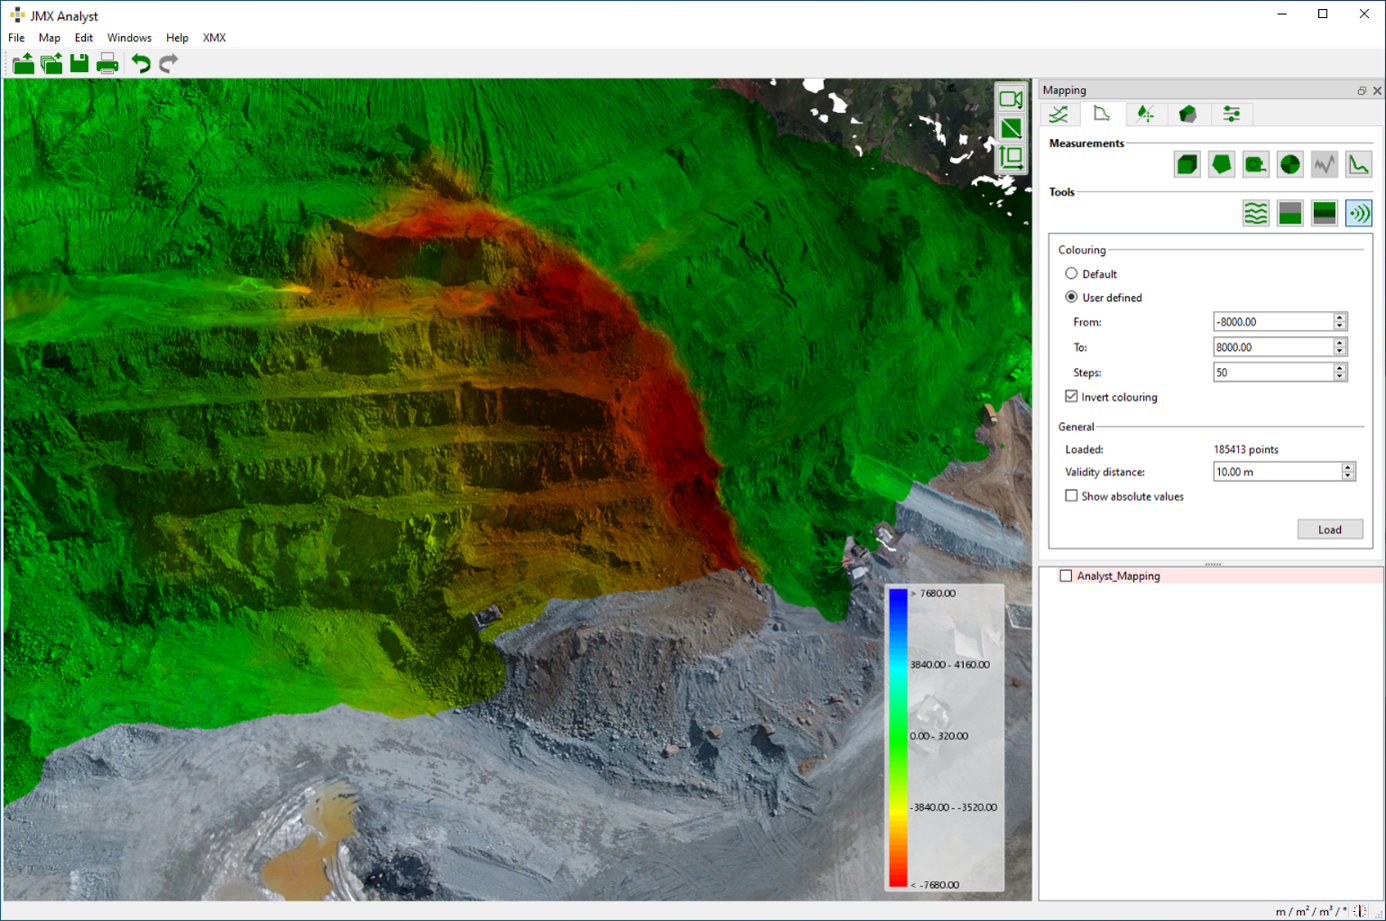
The “.csv” data is loaded by clicking the “Load” button in the Geometry tab. After loading the data is immediately visualized by a false colour overlay and the number of loaded points is given in the Geometry tab. The colouring can be adapted by the user. Using the selection “Default” the displacement is visualized using a continuous colour gradient. The selection “User Defined” allows the user to modify the maximum and minimum distance and the number of incremental steps. It is possible to invert the colouring by enabling the corresponding checkbox “Invert Colouring.” The colour code changes to absolute values by enabling the checkbox “Show absolute values.” The “Validity distance” limits the visualization of the colour overlay. The entered value defines the maximum distance between the 3D model and the loaded CSV 4D point cloud and excludes the visualization of areas with larger distances. The below figure shows an example of a user adapted visualization of displacement data.
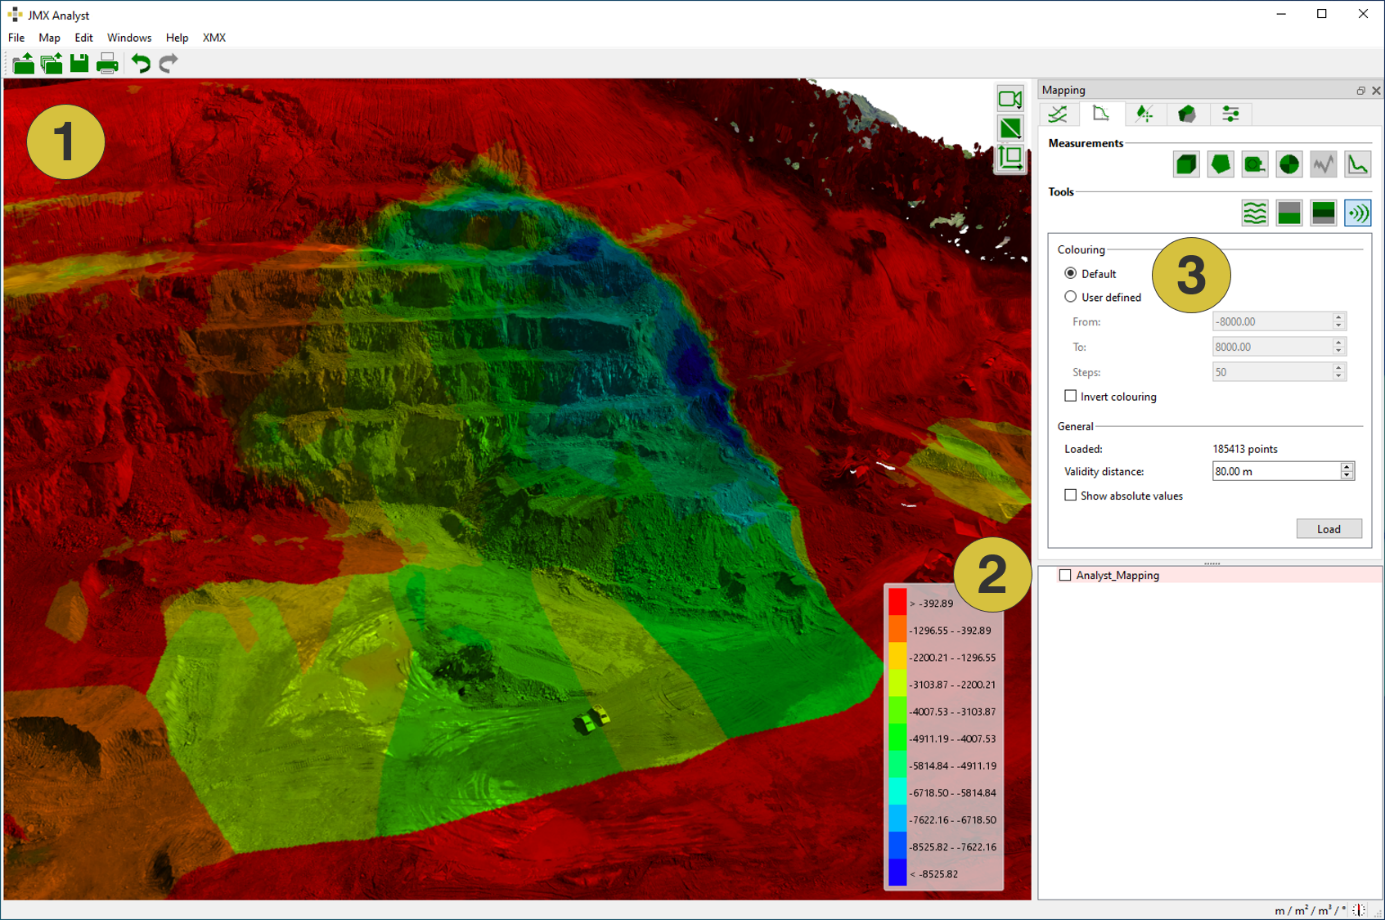
- False colour overlay in the 3D viewer
- Colour legend
- Configuration