Import Reutech Data
This feature allows users to import Reutech sensor data to Slide3. These are the following steps to import the Reutech sensor data in csv format to Slide3. An example of the import can be shown in this page.
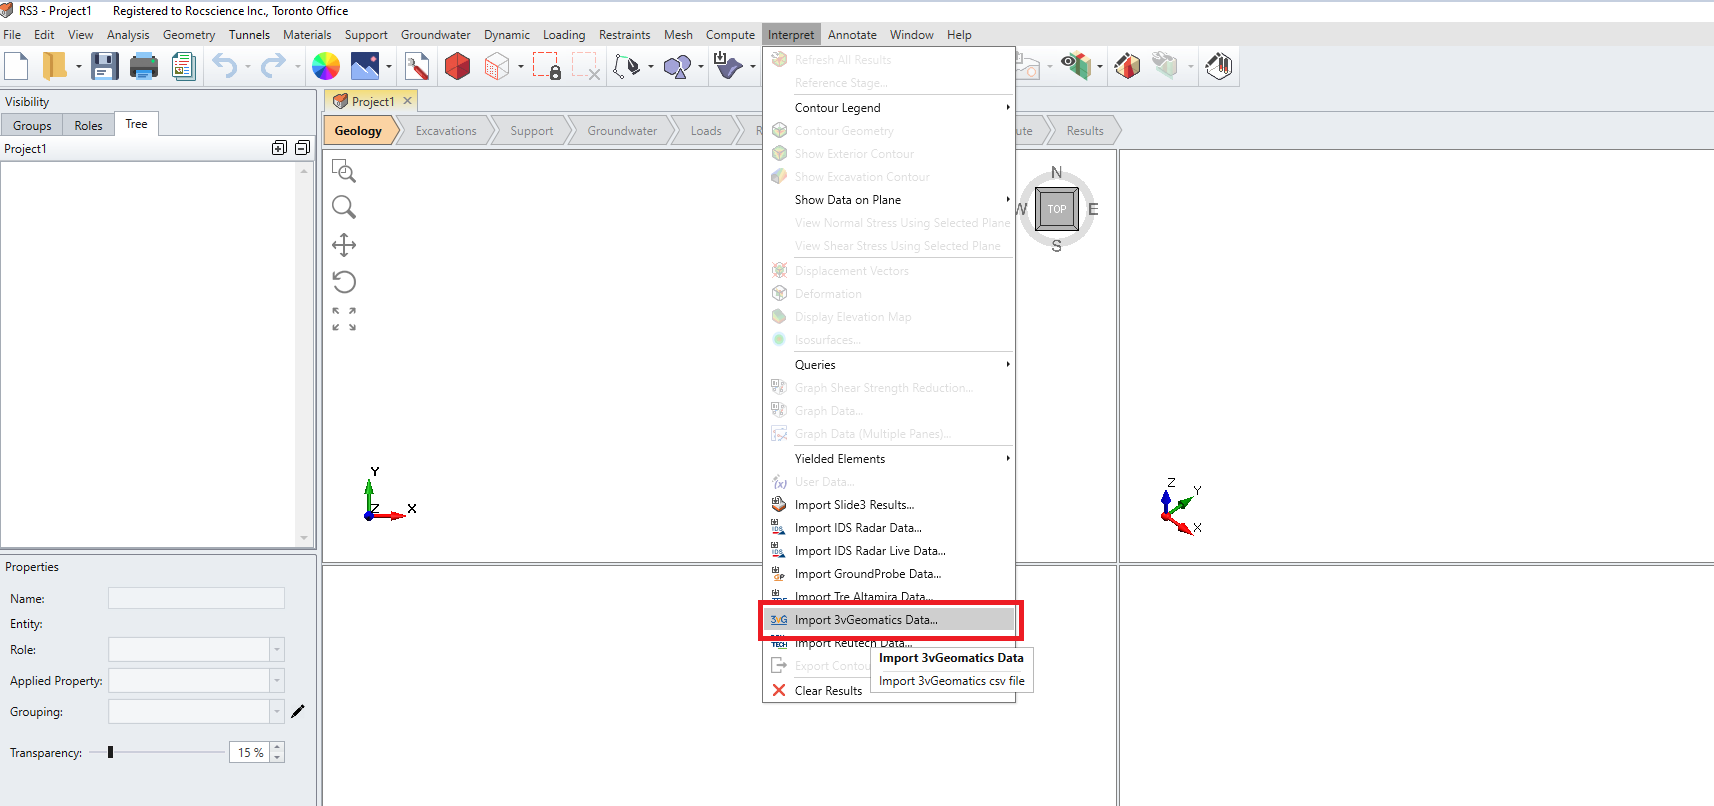
1. Select: File > Import > Import Reutech Data, as shown below.
Or you can also select: Interpret > Import Reutech Data
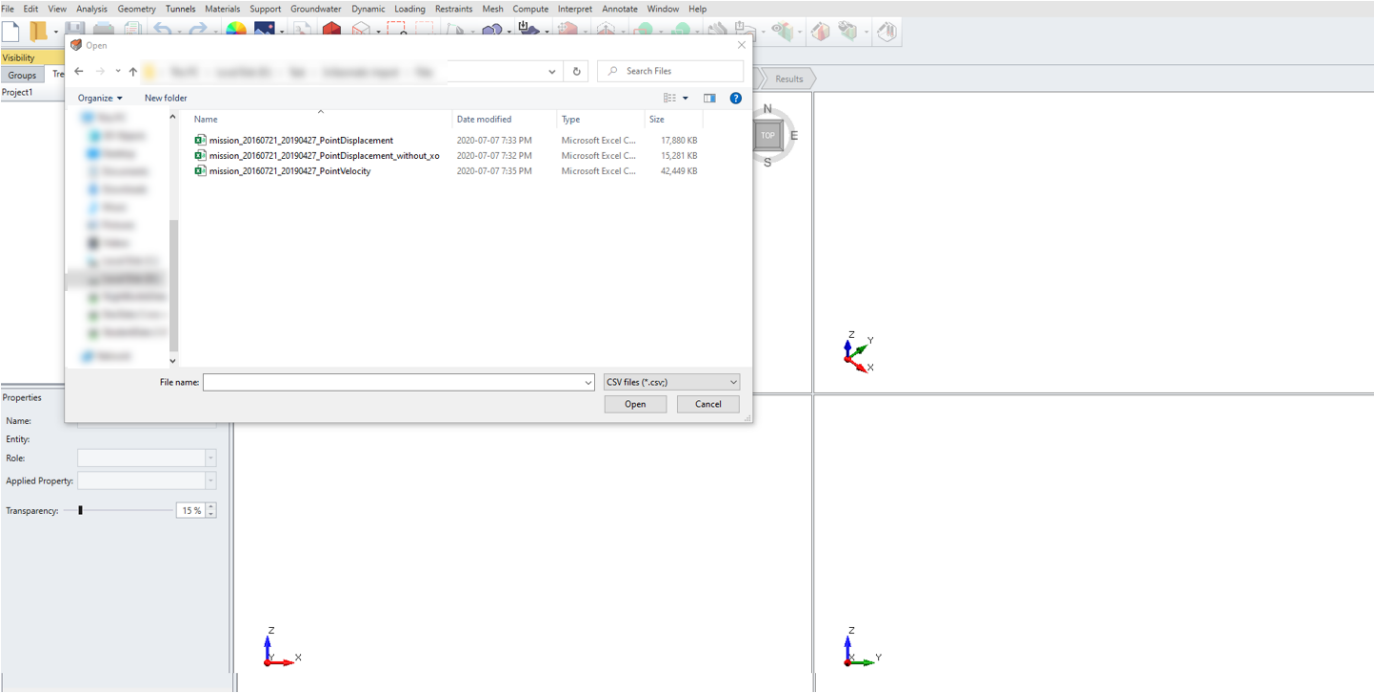
2. After selecting the Import Reutech Data, a file selection window will be opened.
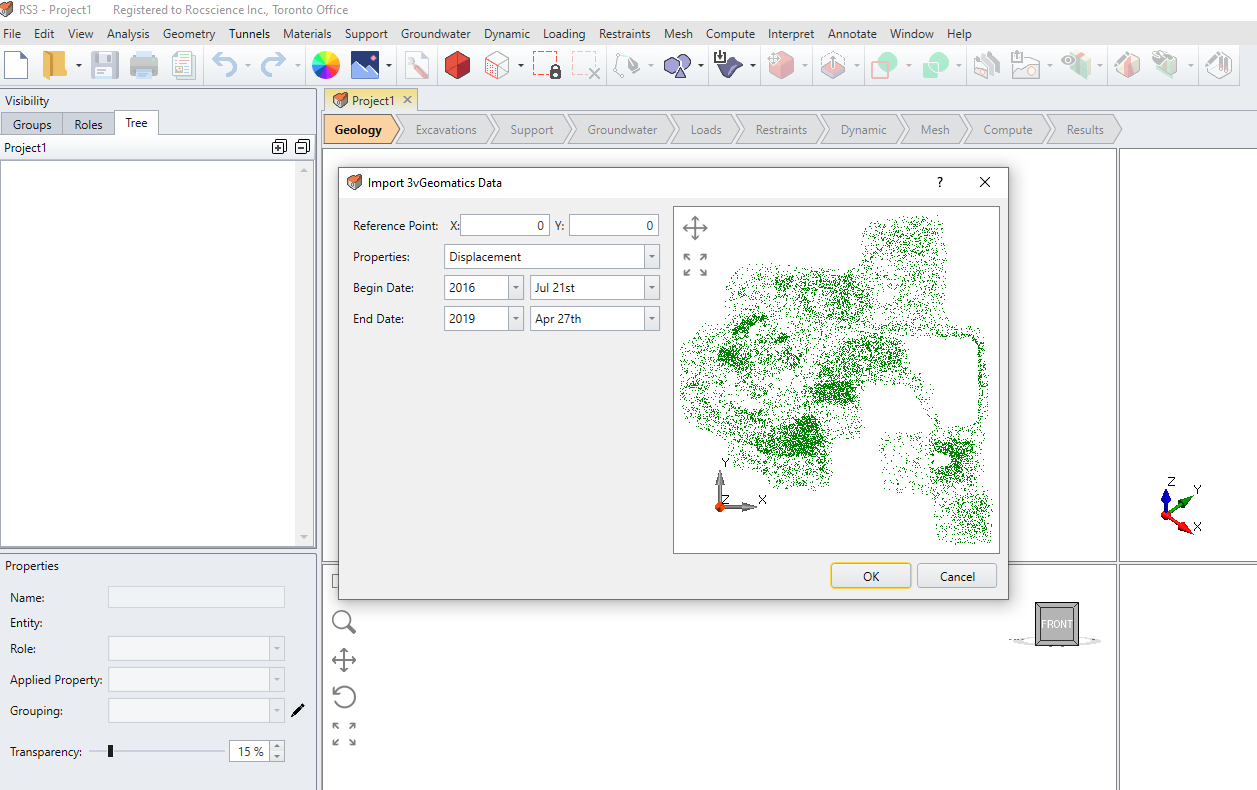
3. When a csv file in Reutech format is selected, it will open an Import Window with some import options. These options are explained below:
Reference Point Display/Selection View: Locates on the right side of the window. It displays the geometry point cloud in top view. There are buttons to allow users to translate or zoom in/out the view. Additionally, users can set the reference point (origin in the local coordinate) by selecting the point on the geometry. The selection updates the value displayed in Reference Point.
Reference Point: Locates in the first line on the window’s left side. It displays the current reference point in X and Y. The reference point is the first point in the file by default, and it is already converted to its local coordinate if the points saved as longitude/latitude in the file. The default value of reference point is (0.0, 0.0). The values displayed are accurate to four decimal places by default. The users can enter values to set the reference point according to their needs.
Properties: Locates below Reference Point. It contains all the available properties to import form the file. The selectable properties include Relative Range, Average Velocity, and Velocity Delta.
If users click Cancel button, the import process will abort and return to the main window. When OK button is clicked, it will move to the next stage.
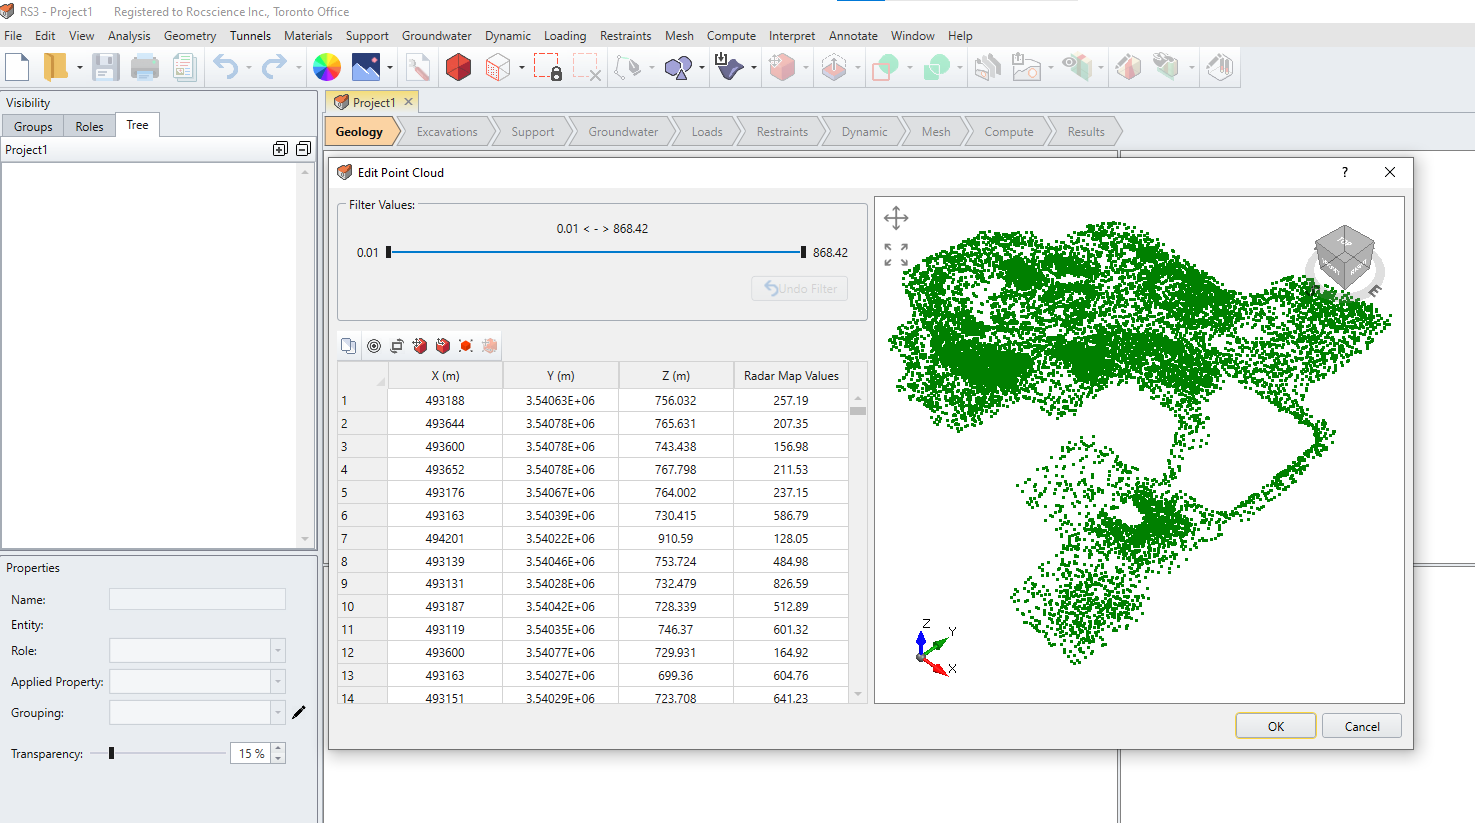
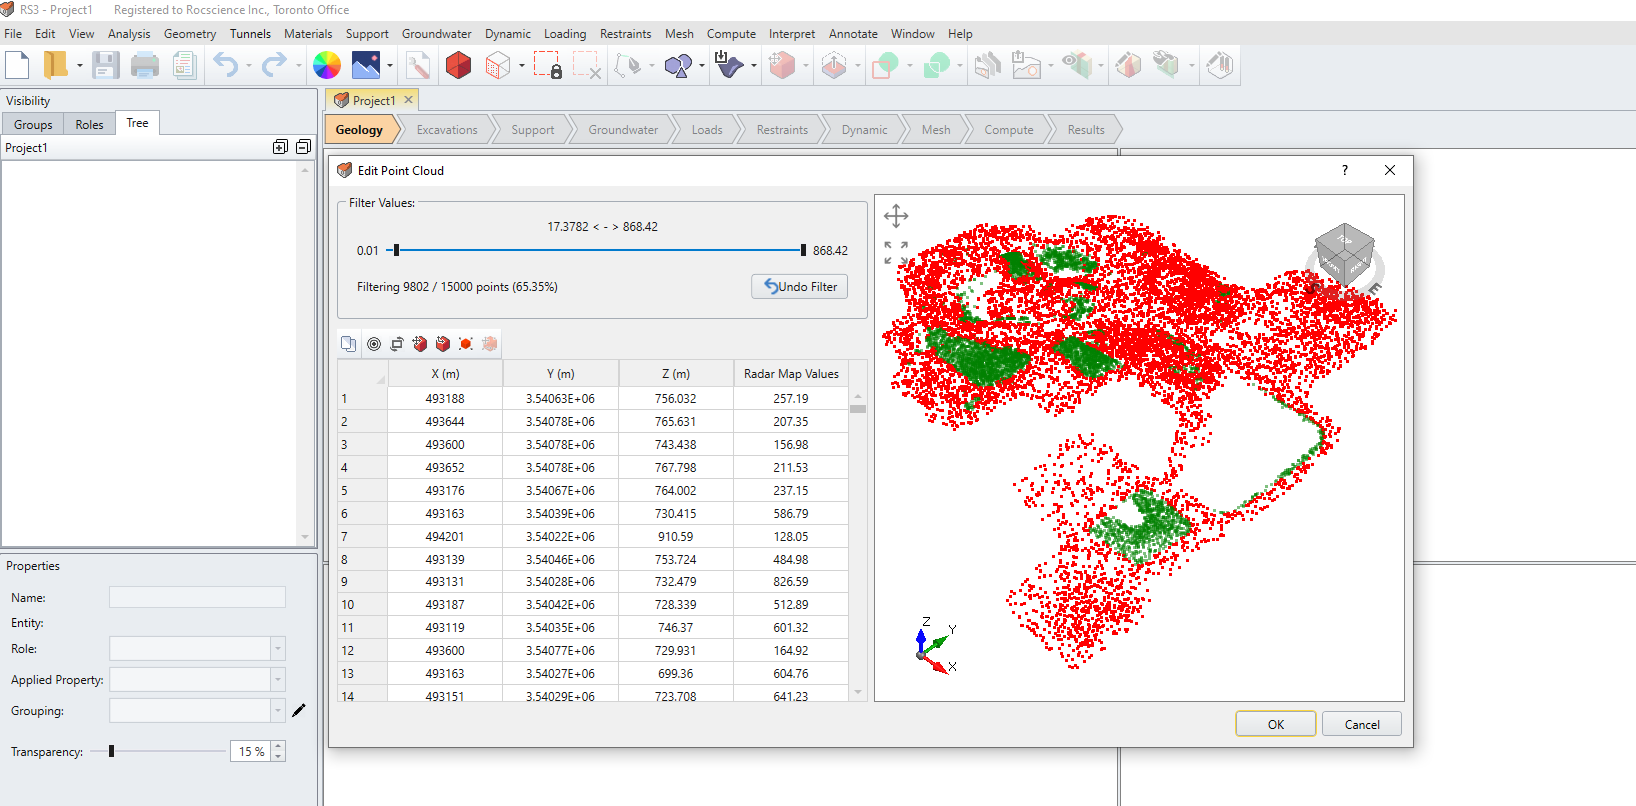
4. In Edit Point Cloud Window, it provides couples of options to allow user to edit the point cloud, including translate, rotate, scale, change orientation and data filtering, and a viewport to preview the edited point cloud. Select OK to complete the edit.
The filtered points, whose values are out of range, are rendered in red color; while the unfiltered ones are in green color.
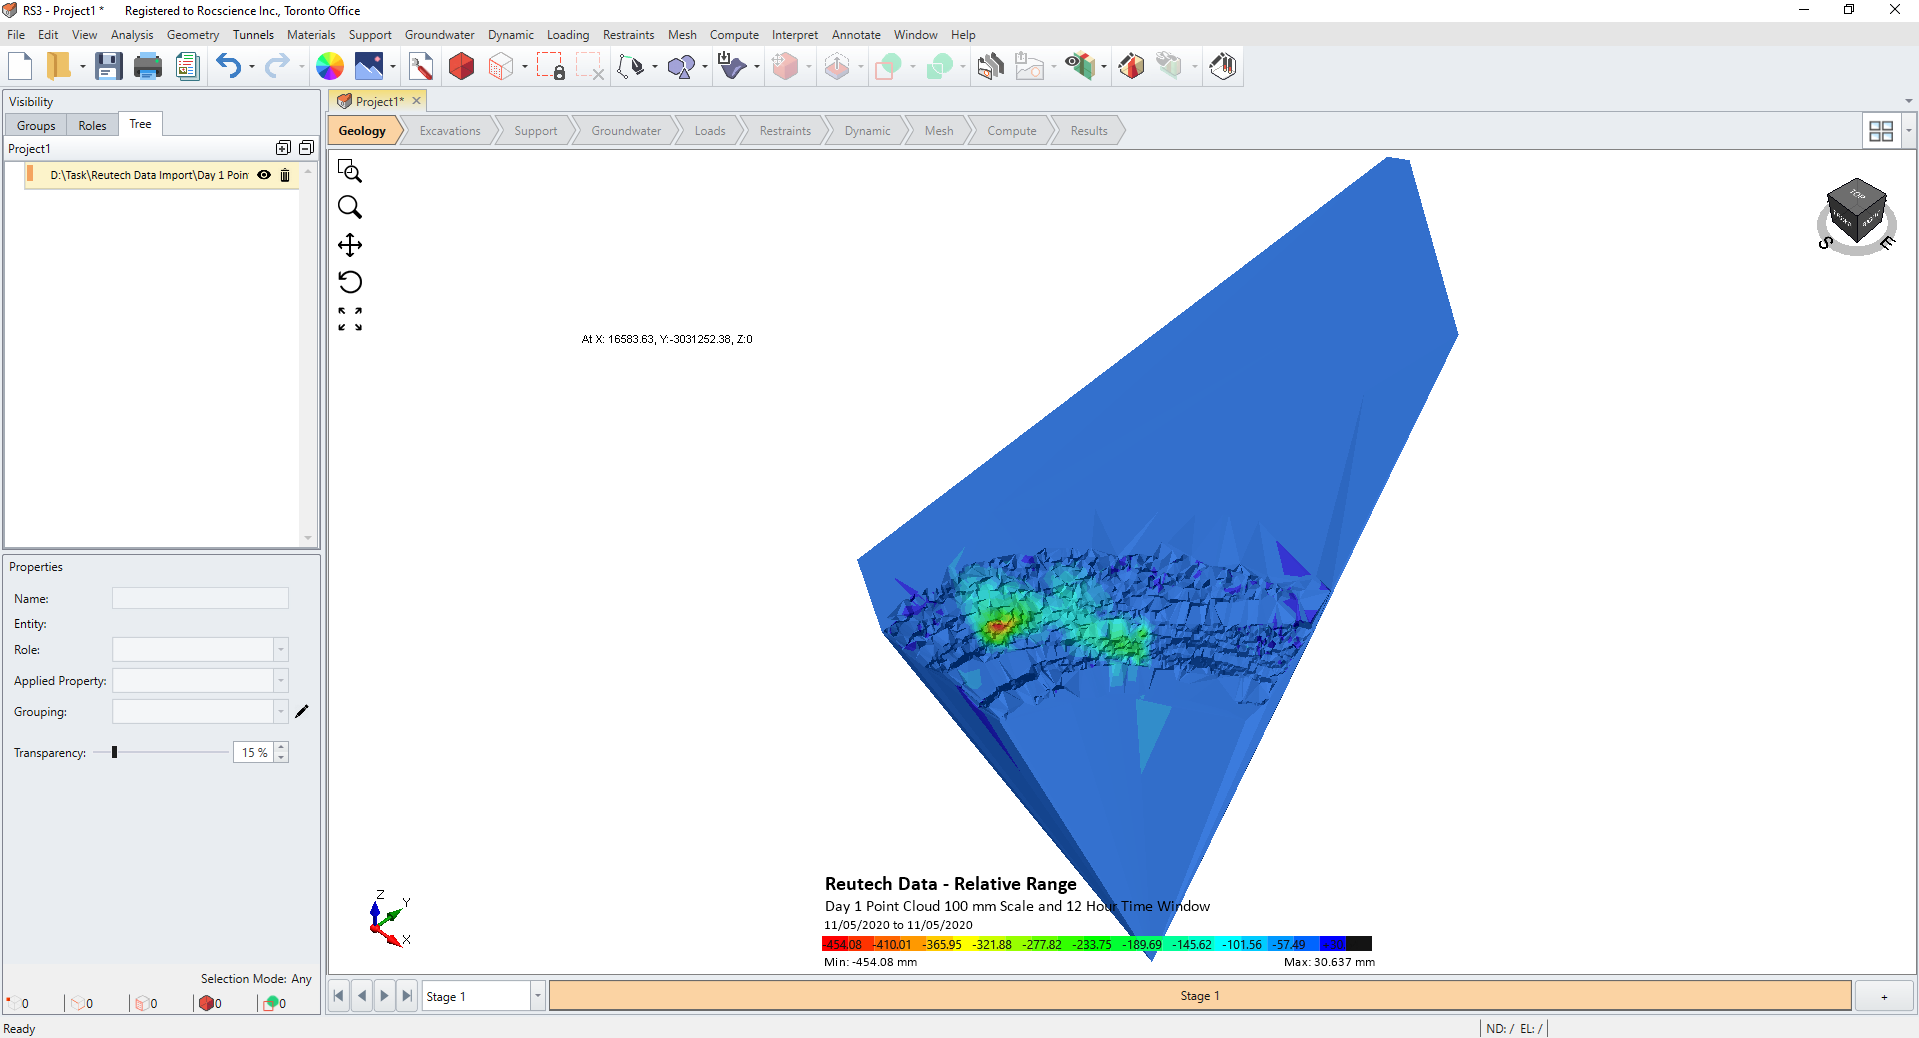
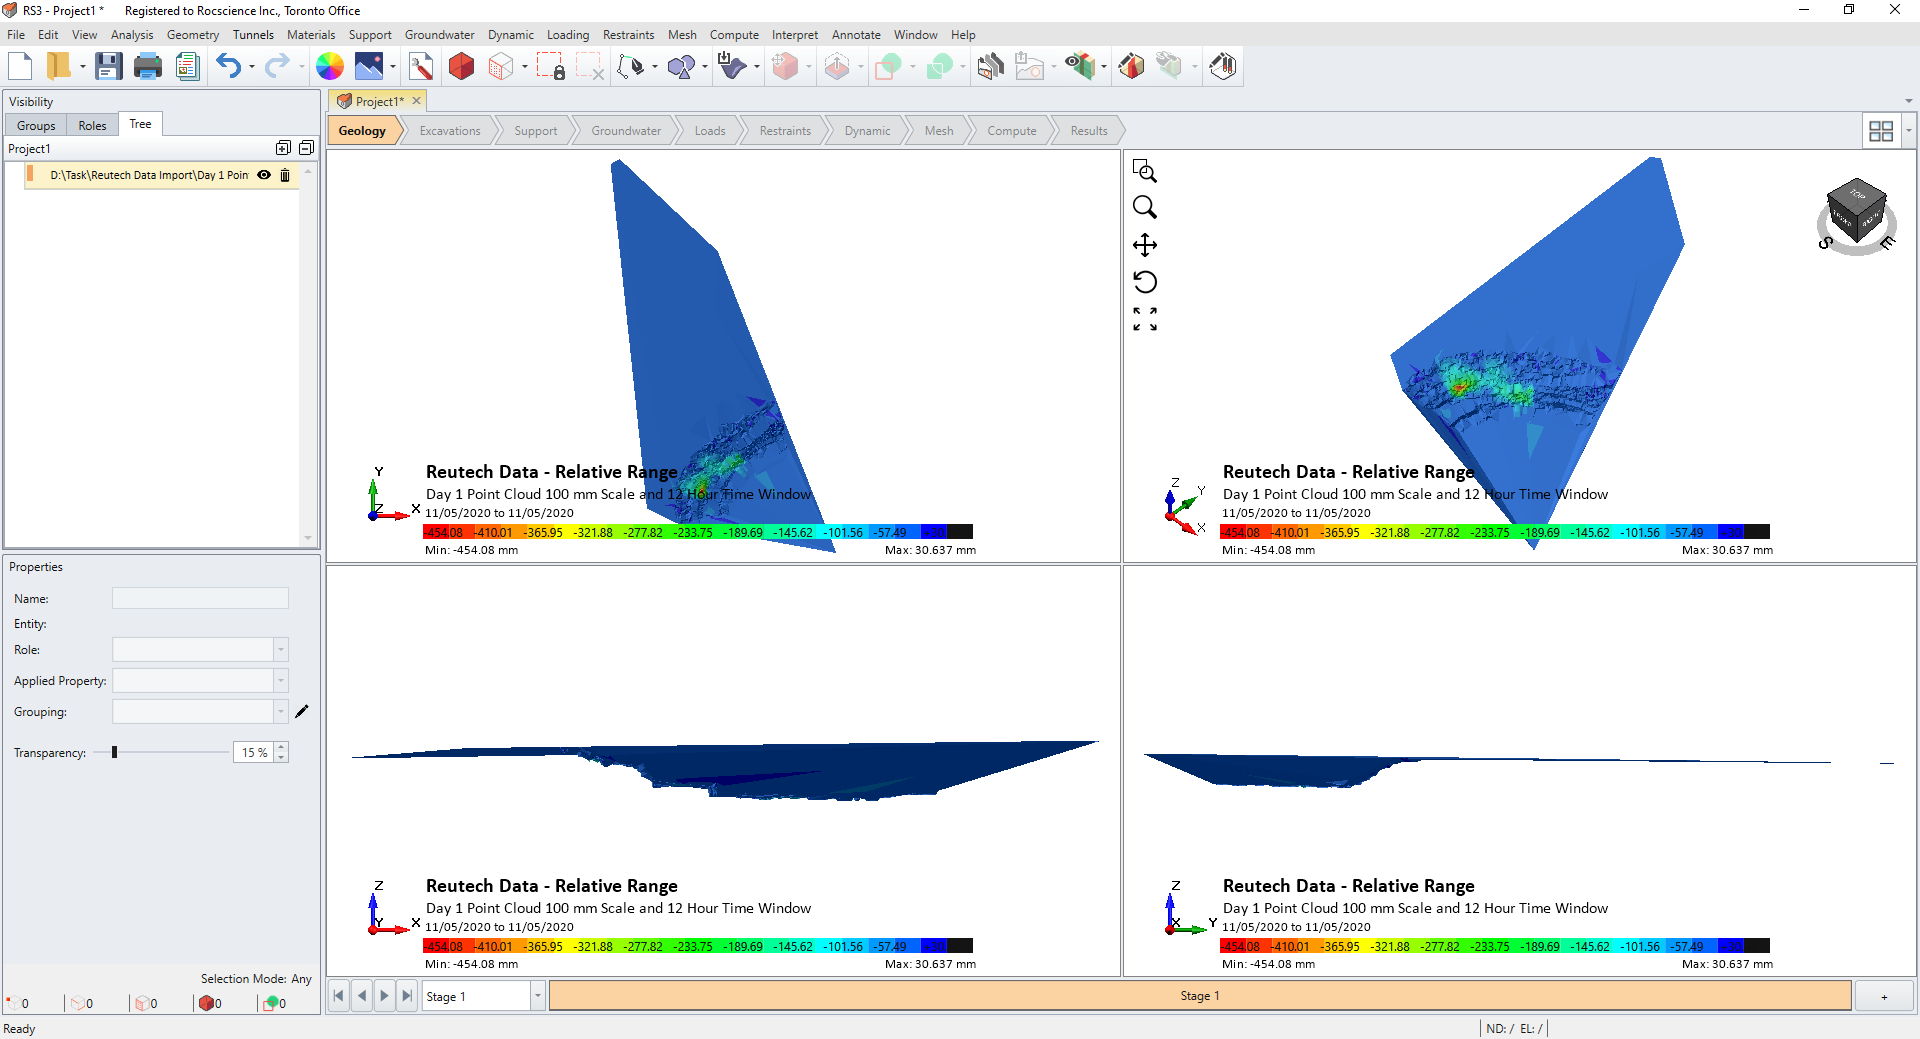
5. The imported result looks like this in all the views.
The default display mode is in Point Cloud, but users can set it to Solid Mesh in Properties panel. Properties panel is on the bottom left corner of the main window select: View Options > View Mesh > Solid Drawing.
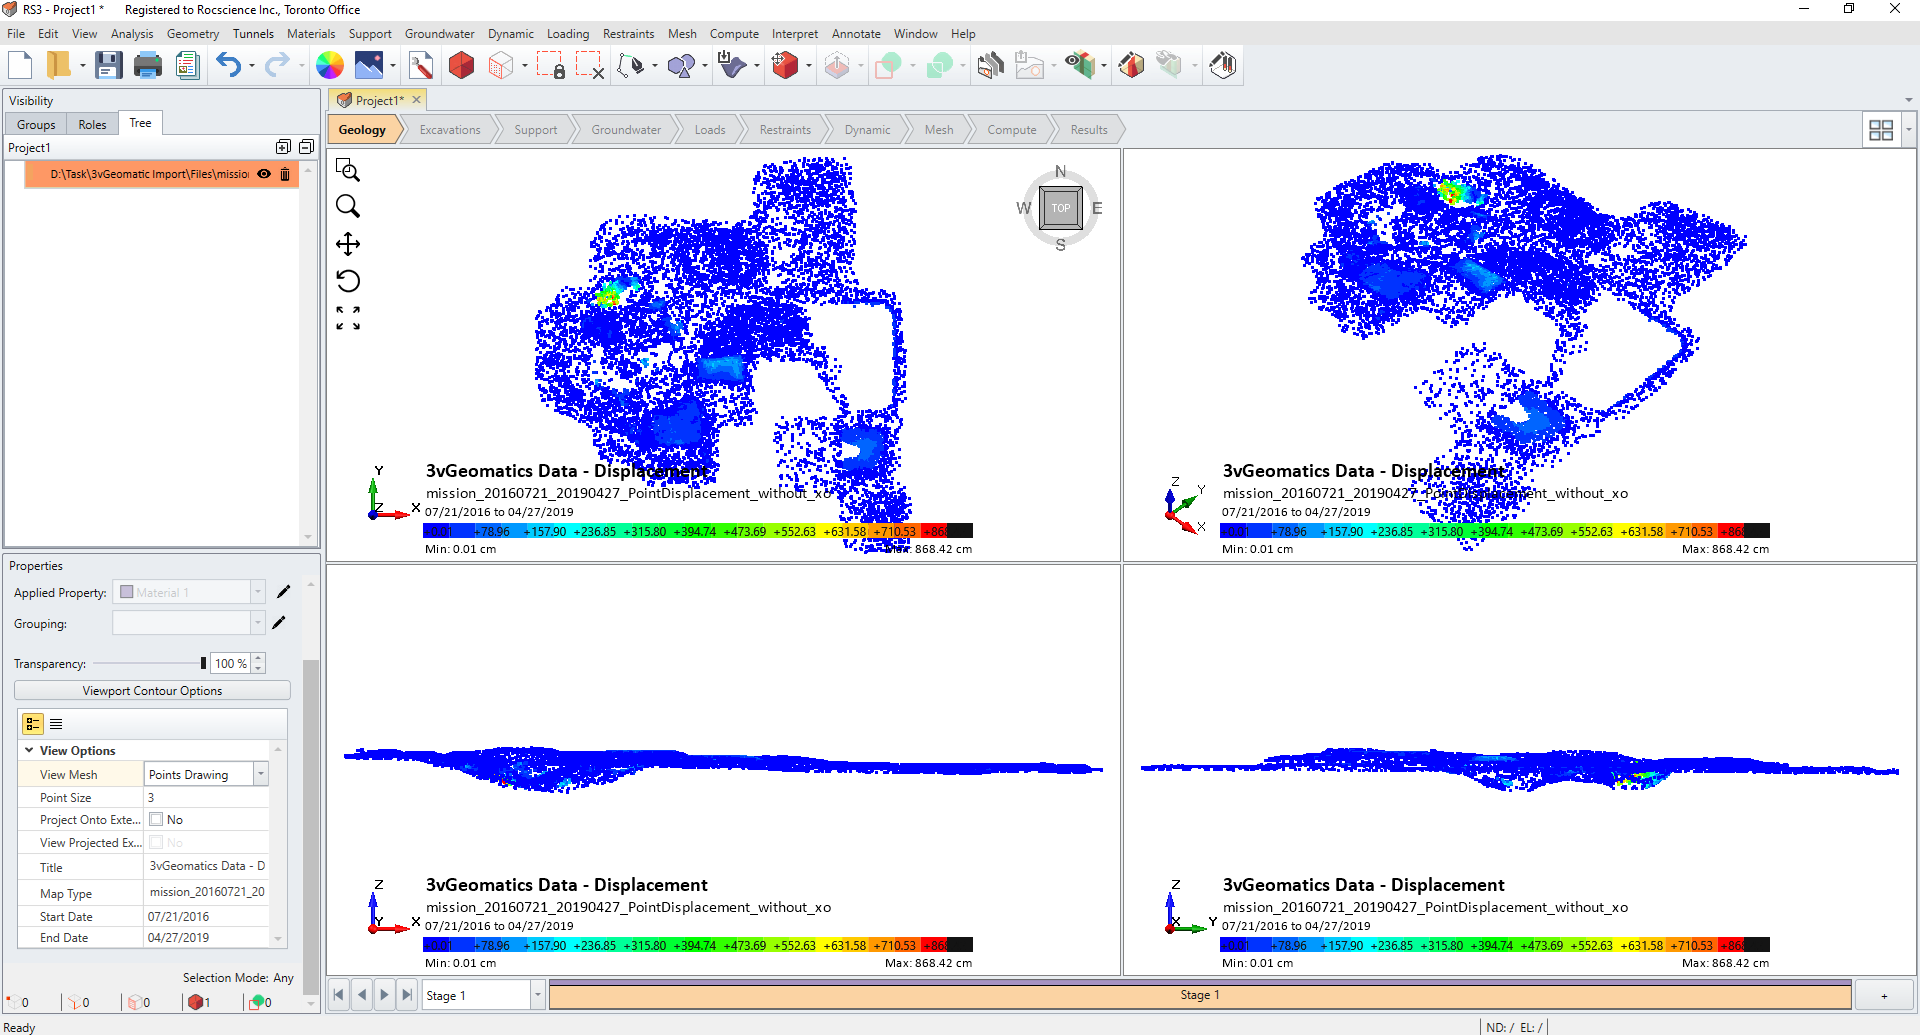
It automatically updates the views by rendering the geometry in solid mesh.
The users can maximize the view they want to keep by double clicking on the view and it will hide all the others for a better view. For example, here we only keep the 3D view, which is on the top right corner, and it looks like this: