RSWebinar: Designing Cost-Effective Ground Improvement Solutions with Settle3 | June 7th, 2023
 

Search Results

Show Contours

The Show Contours option allows you to toggle the display of contours of analysis data on the Global Minimum slip surface.

  1. Select the Results Results Tab workflow tab.
  2. Select the Show Contours option from the toolbar or the Interpret menu.
  3. Data contours will be displayed on the Global Minimum and the Legend will indicate the contour values.
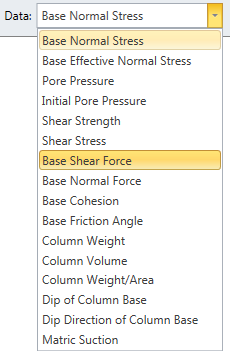
  4. To change the data displayed, select from the Data drop-list in the workflow bar.
Select Base Shear Force from Data Dropdown
Portal Account Log Out Home Shopping Cart icon Click here to search our site Click here to close Learning Tech Support Documentation Info Chevron Delete Back to Top View More" PDF File Calendar Location Language Fees Video Click here to visit Rocscience's LinkedIn page Click here to visit Rocscience's YouTube page Click here to visit Rocscience's Twitter page Click here to visit Rocscience's Facebook page Click here to visit Rocscience's Instagram page Bookmark Network Scroll down for more Checkmark Download Print Back to top Single User Multiple Users RSLog RocFall3 CPillar Dips EX3 RocFall RocPlane RocSupport RocTopple RS2 RS3 RSData RSPile Settle3 Slide2 Slide3 SWedge UnWedge Commercial License Education License Trial License Shop safe & secure Money-back guarantee