Column Data Viewer
The Column Data Viewer option allows you to view detailed analysis results for individual columns in a sliding mass.
- Select the Results
 workflow tab.
 - Select Column Data Viewer from the toolbar or Interpret menu.
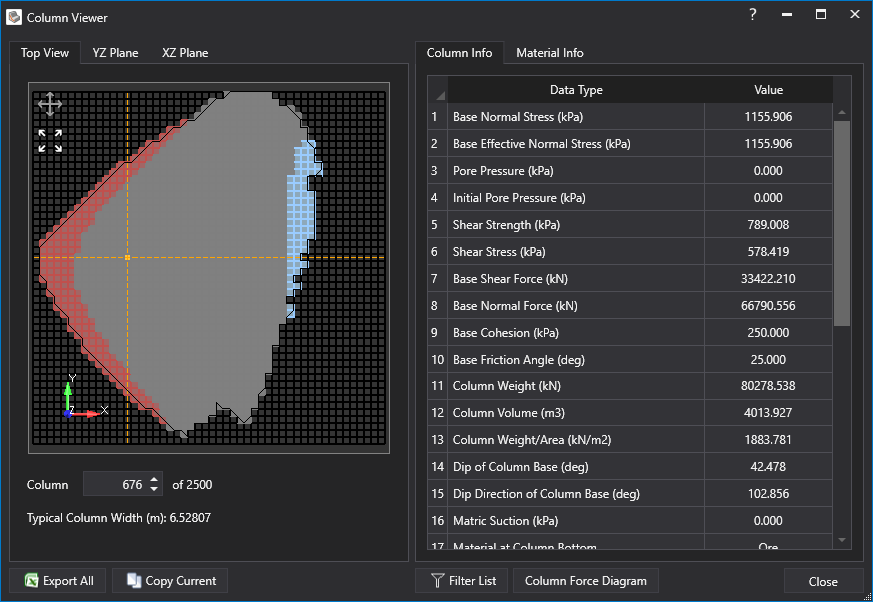
- You will see the Column Viewer dialog.
- Columns can be selected from the Top View, or from a moveable plane in the YZ or XZ planes.
- Detailed results for the selected column are displayed at the right of the dialog.
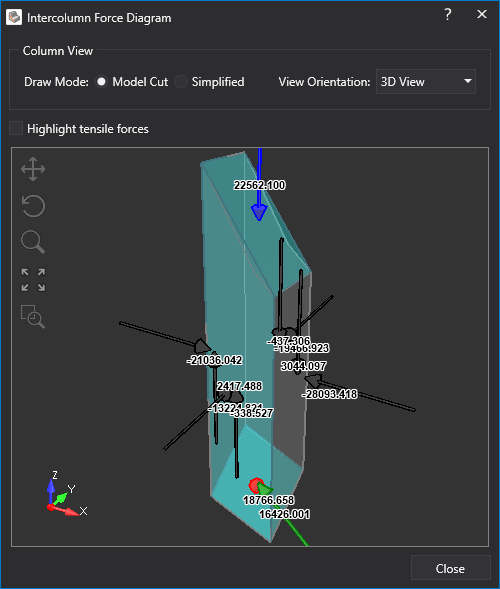
Below is an example of a column viewer dialog that shows the results. The Ex and Ey intercolumn forces are also available in column viewer in the data with function 'Intercolumn force diagram'.
The definition of Ex, Ex+1, Ey, Ey+1 are shown below. All four forces are shown in the dialog. Dialog shows all columns where any of these 4 values are negative in the Top View, YZ and XZ plots in a different colour.