Tension Map Analysis
The Tension Map Analysis feature in the Support menu, is an analysis method that determines the maximum required tensile forces for a set of geosynthetic reinforcement for a given factor of safety. This serves as a strong basis for initial geosynthetic support system design and is compatible with RSWall.
The Tension Map Analysis is based on the top-down method presented by Leshchinsky et al. (2014; 2016; 2017) with additional improvements. The purpose of the analysis is to determine the maximum tension force each individual geosynthetic will experience as part of a retaining wall design.
The results of the analysis and subsequent design are dependent on multiple parameters, notably reinforcement length, spacing, soil parameters, and slope angles. The method is flexible enough to be used for a variety of MSE designs.
Top-Down Tension Map Algorithm
The formulation adopted from Leshchinsky et al., which serves as the foundation for both the original and improved methods, is outlined below.
- The analysis begins at the highest geosynthetic reinforcement in the model. A slope stability analysis is performed with an imposed slope limit such that the failure surface exits just above the reinforcement layer immediately below the top reinforcement.
- For each reinforcement intersecting a slip surface — referred to as an activated reinforcement — the tension in the reinforcement is adjusted so that the slip surface satisfies the specified factor of safety (FS). This calculated tension is recorded as the required tension Treq for the increment where the slip surface intersects the reinforcement. At this stage, connection strength is not considered, allowing the full tension to develop along the reinforcement.
- The analysis is then repeated with the slope exit positioned just above the reinforcement layer directly below the previous one (if present). In this step, all previously activated reinforcements above the current one are also considered in the analysis.
- If at any point the required tension Treq at an increment exceeds the available pullout resistance, the value is capped at the pullout strength estimated at that increment. The difference between the calculated Treq and the pullout strength is redistributed among all other reinforcements that are still adjustable. The current reinforcement is then excluded from further adjustment.
- This procedure repeats until the final reinforcement is reached, at which point a final slope stability analysis is conducted with the slope limit at its original location. Ideally, this location corresponds to a point that allows all reinforcements to be activated, such as the toe of an MSE wall.
- Through this iterative process, a map of tension distributions is developed for each reinforcement. The maximum recorded tension along each reinforcement is stored as Tmax.
- Users can modify reinforcement parameters as needed to achieve a satisfactory design.
- Since the above methodology focuses on providing tensions limited by the pullout strength, design iterations may not necessarily require changing tensions but could also include adding more geosynthetics, increasing length, reducing spacing, changing properties, etc.
Slide2 utilizes an Optimized Tension Map Analysis method as the default. Unlike the original top-down method proposed by Leshchinsky et al. [1], this method performs the analysis for the entire slope at once, rather than sequentially for each reinforcement layer. This leads to several key advantages:
- Significantly faster analysis with identical search parameters.
- Similar results obtained when using the same search parameters.
- Slope limits can be applied to define specific surface entry and exit points.
- Elimination of unnecessary reinforcement checks in cases where slip surfaces are constrained by model conditions such as weak layers, sliding along reinforcements, or predefined slope limits.
According to Article 11.10.5.6 of the AASHTO LRFD Bridge Design Specifications (2024), the nominal tension force determined using a limit equilibrium analysis and Leshchinsky’s method shall use load and resistance factors of 1.0. As such, factors of 1.0 are considered for all aspects of the analysis by default. This can be toggled off by unchecking the “Use design factors of 1.0 (AASHTO 2024 cl. 11.10.5.6)” checkbox should you want to conduct an analysis using design factors.
To use Tension Map feature:
- Select Support > Tension Map.
- Select the Compute reinforcements tension map checkbox.
- Enter the desired target factor of safety.
- Select Use top-down tension map algorithm if desired.
- Compute
 the model.
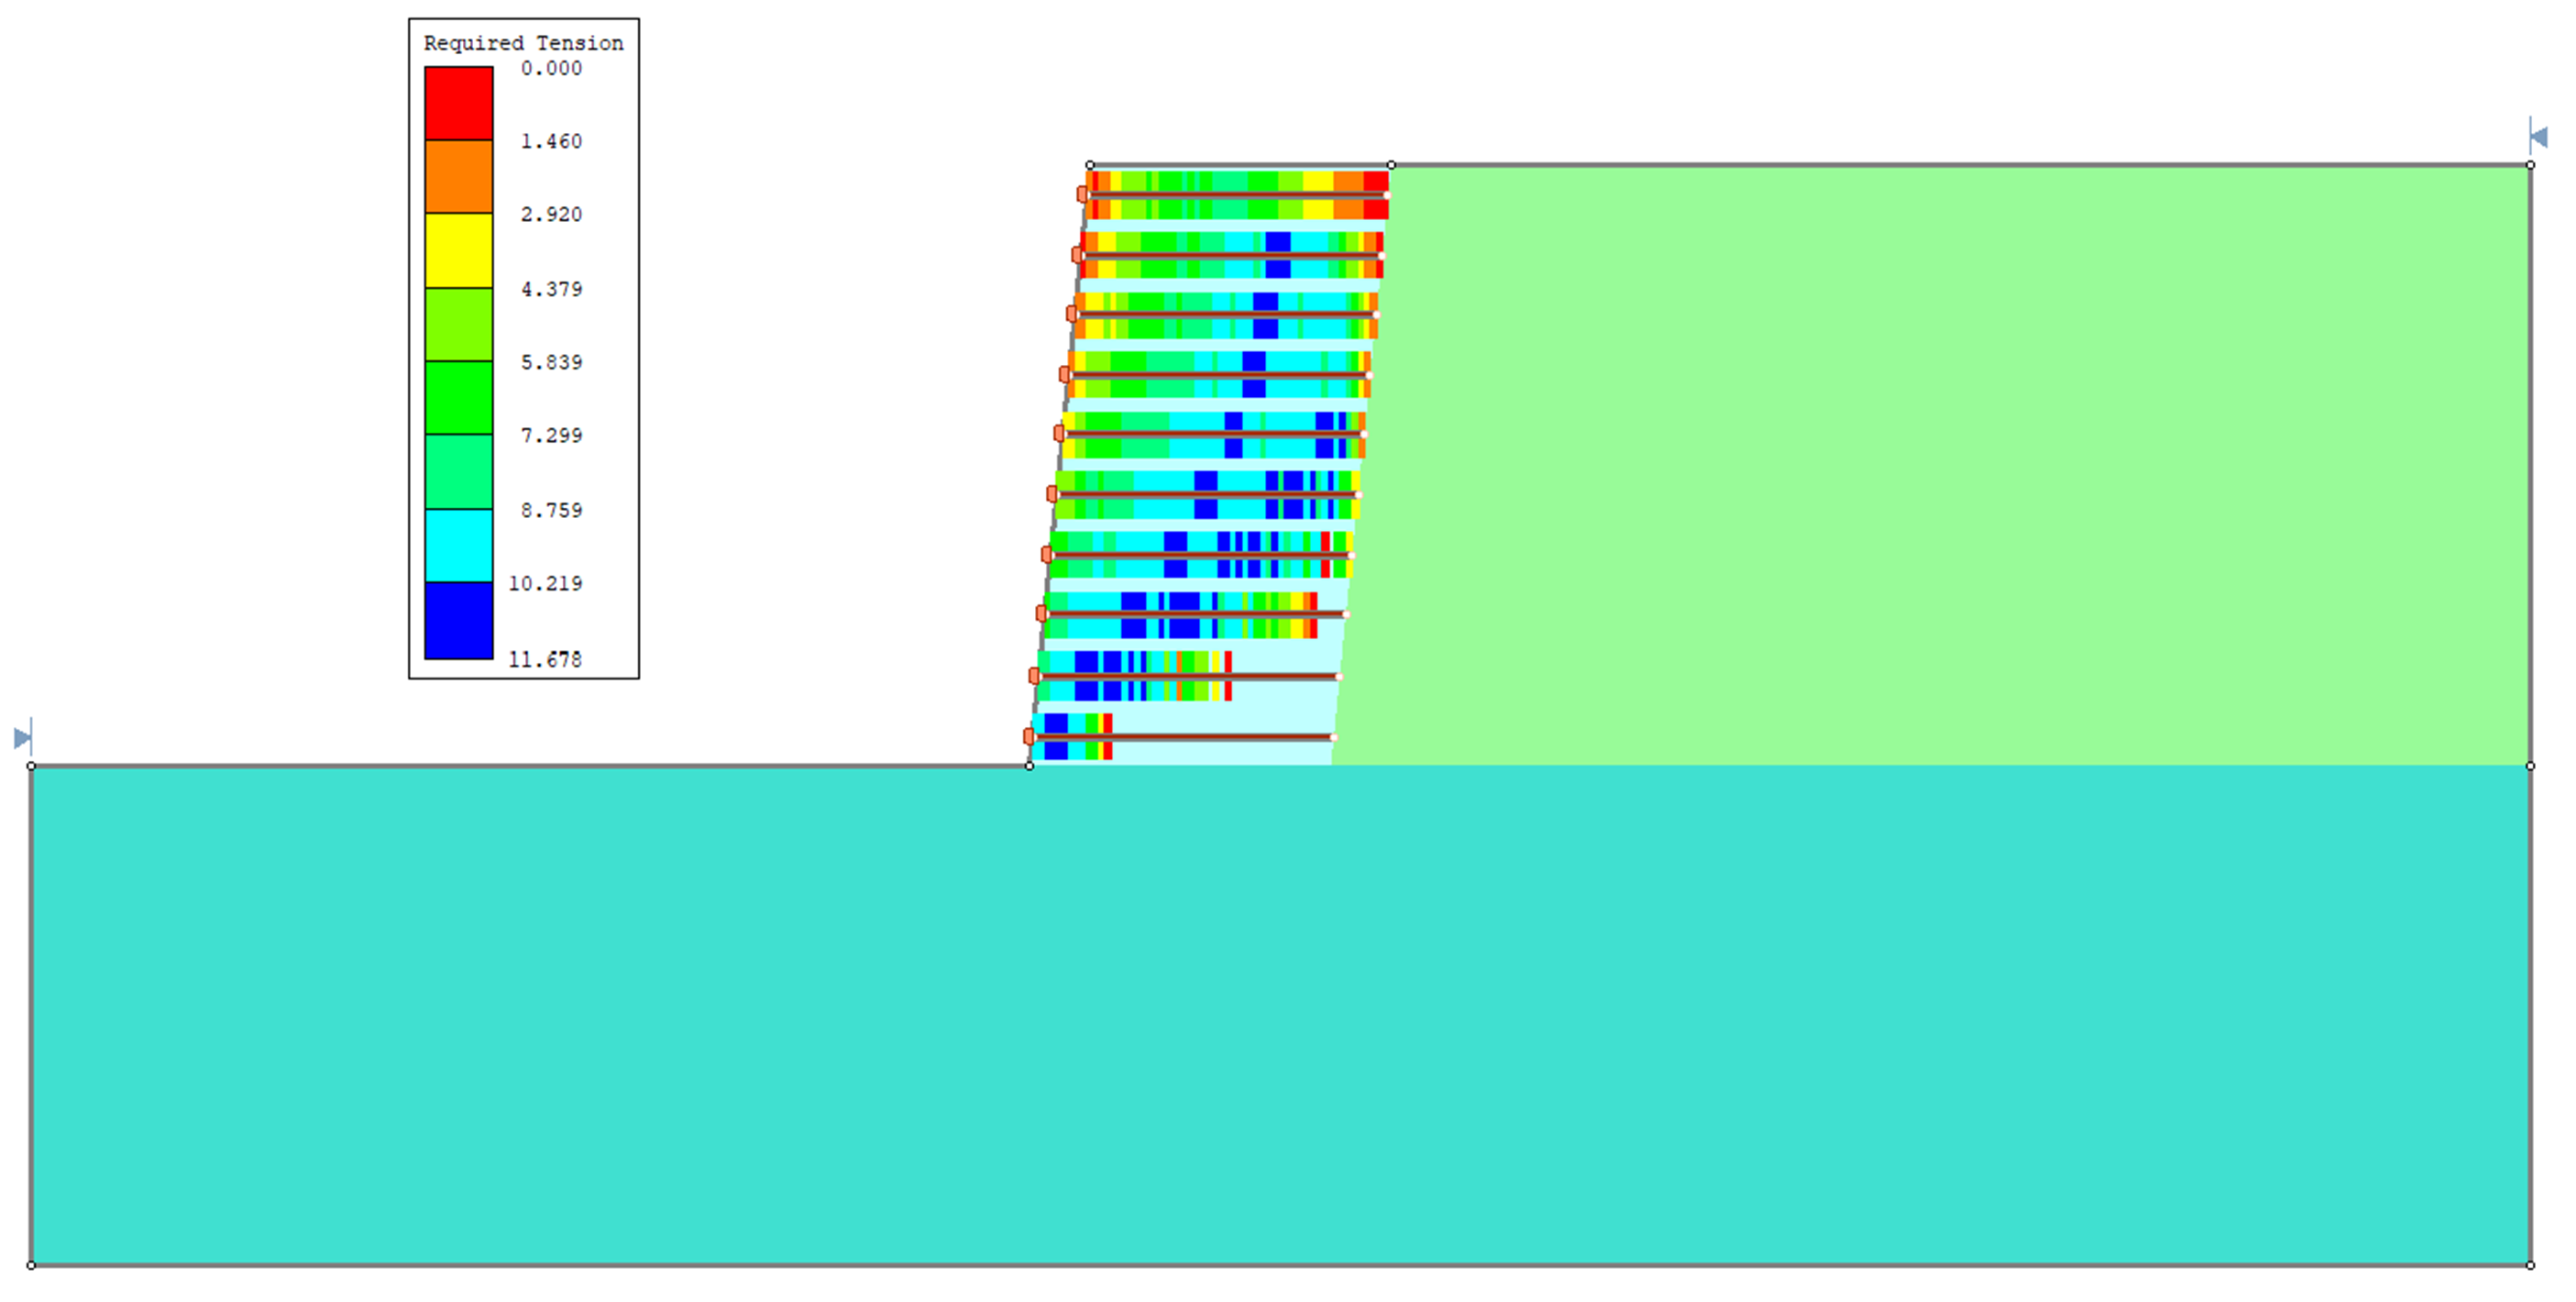
 - The results of the Tension Map Analysis can be viewed in Slide2 Interpret
 by selecting Data > Show Support Tension Map. The contour display and legend settings can be customized in the same manner as those for slope stability and groundwater results.
- Any number of geosynthetic reinforcements can be defined; however, only horizontal reinforcements are considered in the analysis. Reinforcements that do not meet this requirement will be excluded from the calculation.
- The factor of safety (FS) results are based on the initial model conditions defined by the user.
- Both circular and non-circular slip surface analyses are supported.
- The initial tensile strength of valid reinforcements does not influence the analysis. However, after reinforcement is applied, new critical slip surfaces may be found particularly through non-circular search methods or surface alteration. An iterative design process is recommended to refine the reinforcement configuration. This process has been optimized for efficiency.
References
- Leshchinsky, B.A., Insight Towards the Stability of Complex Geosynthetic Reinforced Soil Structures, Geosynthetics: Leading the Way to a Resilient Planet, September 2023, pp 161-180.
- Leshchinsky, D., Kang, B., Han, J., Ling, H., Framework for Limit State Design of Geosynthetic-Reinforced Walls and Slopes, Transportation Infrastructure Geotechnology, March 2014, pp 129-164.
- Leshchinsky, D., Leshchinsky, B., Leshchinsky, O., Limit state design framework for geosynthetic-reinforced soil structures, Geotextiles and Geomembrances, August 2017, pp 642-652.
- Leshchinsky, D.,Leshchinsky, O., Zelenko, B., Horne, J., Limit Equilibrium Design Framework for MSE Structures with Extensible Reinforcement, Federal Highway Administration, October 2016.