Tension Crack Statistics
If you are modelling a Tension Crack with Slide2, there are TWO aspects of the Tension Crack which can be treated as Random Variables in a Probabilistic Analysis:
- The location of the Tension Crack.
- The level of water in the Tension Crack.
Tension Crack Location
The method of defining the Tension Crack Location as a Random Variable is identical to the method of defining the Water Table Location as a Random Variable. That is:
- You must define Minimum and Maximum Tension Crack boundaries, to denote the upper and lower statistical limits of the Tension Crack boundary (select Statistics > Tension Crack > Draw Min Tension Crack and Statistics > Tension Crack > Draw Max Tension Crack).
- You must define the statistical distribution for the Tension Crack Location, with the Tension Crack Statistics dialog (select Statistics > Tension Crack > Statistical Properties).
For detailed information, please see the Water Table Statistics topic, as the procedure is essentially the same.
However, we will make note of one special case, concerning the Tension Crack Location as a Random Variable.
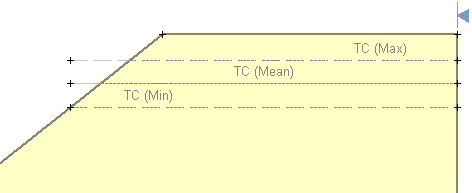
You should ALWAYS MAKE SURE that the Maximum Tension Crack boundary, has the same left and right X-coordinates as the Minimum Tension Crack boundary. In some cases, you may have to draw part of the Maximum Tension Crack boundary, OUTSIDE OF the External Boundary of the model. This is illustrated in the figure below.

Maximum Tension Crack Boundary – correct definition
This is necessary if you want to ensure that all of the randomly generated Tension Crack boundaries, between the Minimum and Maximum boundaries, extend across the intended portion of the slope. Any portion of a randomly generated Tension Crack boundary, which extends outside of the External Boundary, will be clipped at the point where it intersects the External Boundary, and will not affect the analysis.
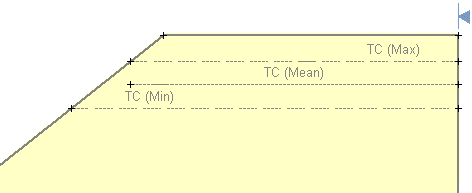
If the Maximum Tension Crack boundary is NOT extended past the slope (as shown above), but terminated at the slope (as shown below), then the randomly generated Tension Crack boundaries will terminate within the slope, rather than continuing to the slope face. If this is NOT your intention, then DO NOT draw the Maximum boundary as shown below.

Maximum Tension Crack Boundary – in correct definition
Tension Crack Water Level
The water level in a Tension Crack can be defined as a Random Variable if you are using one of the following methods of specifying the Water Level:
- Percent Filled
- Filled to Elevation
- Filled to Depth
If you are using one of these three methods, then you can define the Tension Crack Water Level as a Random Variable, as follows:
- Select Statistics > Tension Crack > Statistical Properties.
- You will see the Tension Crack Statistics dialog.
- Select a Statistical Distribution, and enter a Standard Deviation (if applicable), and Relative Minimum and Maximum Values.
- For more information about the statistical parameters which are used to define Random Variables in Slide2, please see the Random Variables topic.
Or a convenient right-click shortcut is also available – simply RIGHT CLICK the mouse anywhere on the Minimum, Mean or Maximum Tension Crack boundaries, and select Statistical Properties from the popup menu which will appear.
The water level in a Tension Crack CANNOT be defined as a Random Variable if you are using the Dry (no water) or Filled (100% water) options. In this case, the Water Level option will NOT be available in the Tension Crack Statistics dialog.
Tension Crack + Random Water Table
Finally, note that there is one more possibility for specifying a random Water Level in a Tension Crack.
- If the Water Table Location is one of the Random Variables in your Probabilistic Analysis (see the Water Table Statistics topic for details); AND
- The method of determining the Water Level in the Tension Crack is specified as Use Water Table (in the Tension Crack Properties dialog)
Then the Water Level in the Tension Crack will automatically vary, along with the Random Water Table Location.
- In this case, the Water Level option will NOT be available in the Tension Crack Statistics dialog, and you will NOT be able to plot the Tension Crack Water Level as a Random Variable in the Slide2 Interpret program.
- Nonetheless, the Tension Crack Water Level will be "random" insofar as it will be a function of the random Water Table Location (if the random Water Table passes through the Tension Crack zone).
Sensitivity Analysis
If you are performing a Sensitivity Analysis, and the Tension Crack Location is one of the variables you are analyzing, then you must define the Minimum and Maximum Tension Crack Boundaries, as described above for a Probabilistic Analysis. The Sensitivity Analysis will be carried out by uniformly varying the Tension Crack location between the Minimum and Maximum Tension Crack Boundaries, in 50 equal increments.
- If you are performing a Sensitivity Analysis, but you are NOT performing a Probabilistic Analysis, then the Distribution and Standard Deviation options will be disabled in the Tension Crack Statistics dialog, since they are not applicable for a Sensitivity Analysis.
- If you are performing BOTH a Sensitivity Analysis AND a Probabilistic Analysis, then the Sensitivity Analysis will ignore the parameters which are not relevant to the Sensitivity Analysis (i.e. Distribution and Standard Deviation, which are only applicable for the Probabilistic Analysis).
For more information about Sensitivity Analysis with Slide2, see the Sensitivity Analysis topic.