Slip Surfaces and Factor of Safety
Why do my results change when I add or remove limit equilibrium methods?
When computing multiple methods at once (e.g. Spencer, GLE, and Bishop), it's possible that the user may get different results when compared to computing a single method alone (e.g. Spencer only). The reason for this is that at the end of the computation, Slide2 takes all the global minima surfaces from all methods, and computes them with the other methods, in case one turns out to be a better surface.
For example, say at the end of a computation where Spencer, GLE, and Bishop were used, Spencer finds Surface 1 as the global minimum. GLE finds Surface 2. Bishop finds Surface 3.
Subsequently, Surfaces 2 and 3 are recomputed with Spencer. Surfaces 1 and 3 are recomputed with GLE. Surfaces 1 and 2 are recomputed with Bishop.
For Spencer, if Surface 2 gives a lower factor of safety than the original Surface 1, then Surface 2 will be displayed as the global minimum. On the other hand, if the user was computing Spencer alone, Surface 1 would be the global minimum. The same process applies to the other methods.
When I use two sets of slope limits, how are surfaces generated?
When you define two sets of slope limits, there is no explicit logic to force slip surfaces to enter and exit in the two limits, although that is the general purpose of the option. The program still searches each set of limits independently, as well as between the two.
Can I carry out a probabilistic analysis on a single slip surface that I define?
Yes, this can be done in Slide2. What you need to do is turn off the automatic creation of surfaces. If you are doing a circular analysis, simply do a Grid Search but do not define a grid. Then, simply define the single circular surface of interest. If you are doing a noncircular analysis, set the search method to Path Search and the number of generated surfaces to zero. Then add your single surface.
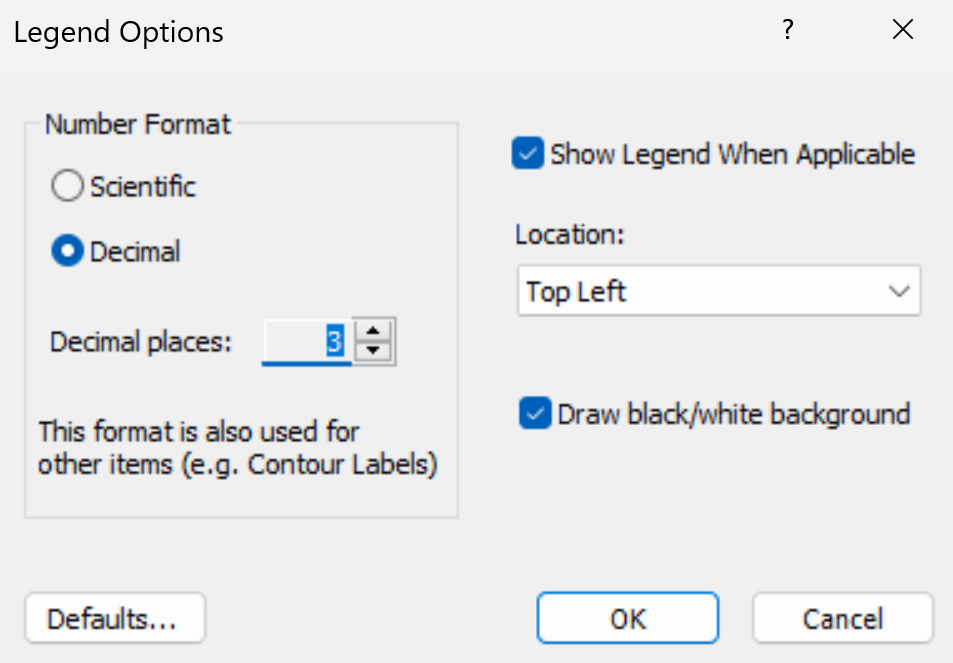
How can I change the number of decimal places displayed in FS?
The Legend Options dialog in the View menu allows you to change the number of decimal places displayed.
What does it mean if I get an error code for a slip surface?
Error codes are generally not critical and the analysis may be fine even if there are error codes generated. In fact, most analyses generate these codes for some of the surfaces. They are warnings that some of the surfaces could not be computed for various reasons (usually geometric).
In general, we don't use the number of invalid surfaces as a measure of whether the analysis is accurate. It really depends on the code generated. If you have a lot of -111 errors, which is the non-convergence code, then you should look into this in more detail (there are many other codes of this type). If the invalid surfaces lie in a region of interest it is even more important to investigate the results in detail.
Codes are also important for tracking down why an analysis may not generate any results or few results only in a particular area. They should always be looked at, but we would not put a limit on the number.
Descriptions of each error code can be found in the Summary of Error Codes topic.
Can Slide2 be used to calculate FS against uplift for a dam?
Not directly. Slide2 is a program to determine the FS against sliding (shear failure) not uplift.
However, you can use Slide2 to determine the pore pressure distribution along the base of the dam. You can also use Slide2 to determine the distribution of weight due to the dam. It is then up to you to compute the FS against uplift.
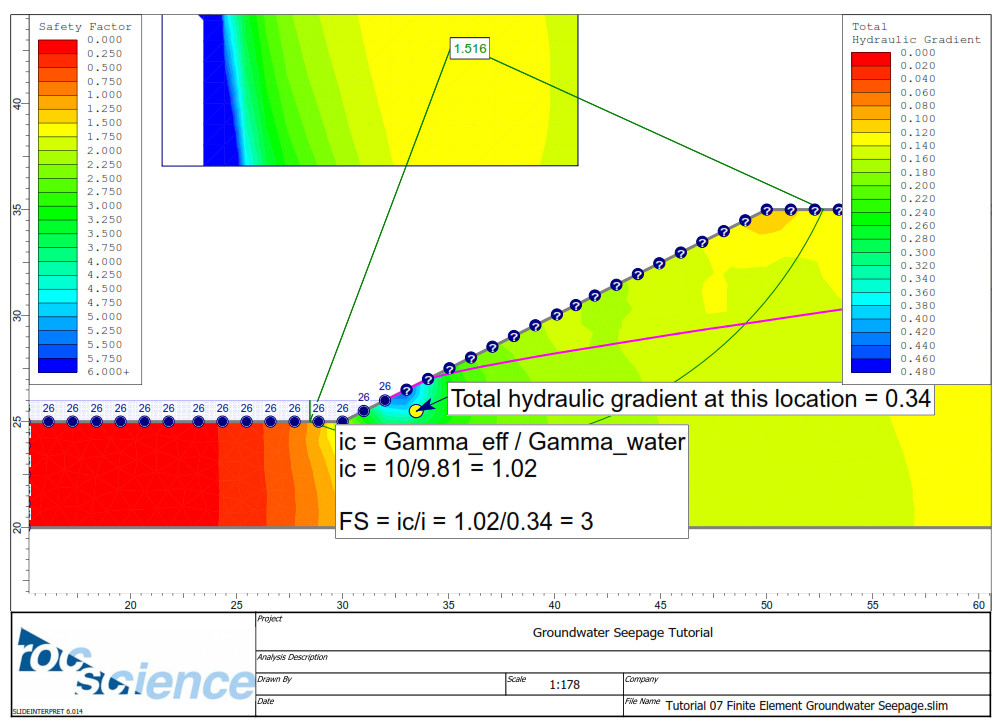
There is also an FS against piping/boiling that you can compute with Slide2 using the total hydraulic gradient from a groundwater analysis:
If you want to calculate the factor of safety against boiling/piping, then the factor of safety is equal to the ratio of the critical hydraulic gradient (defined as the buoyant unit weight divided by the unit weight of the water) to the exit hydraulic gradient at the toe (taken from the Slide2 seepage analysis). See the image below. This approach is similar to the one discussed in "Soil mechanics in engineering practice" by Karl Terzaghi, Ralph Brazelton Peck, Gholamreza Mesri.
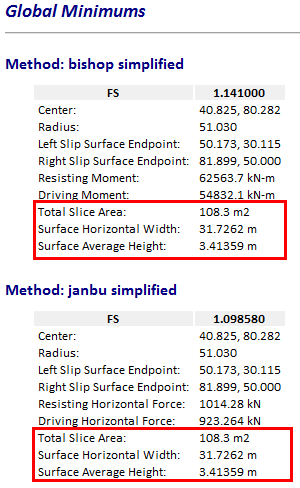
How can I determine the volume or weight of material that may slip, based on the failure surface?
In the InfoViewer, the area of the critical surface can be found where the resisting and driving forces are presented. The surface horizontal width and average height are also displayed.
You can also add up the weight of the slices:
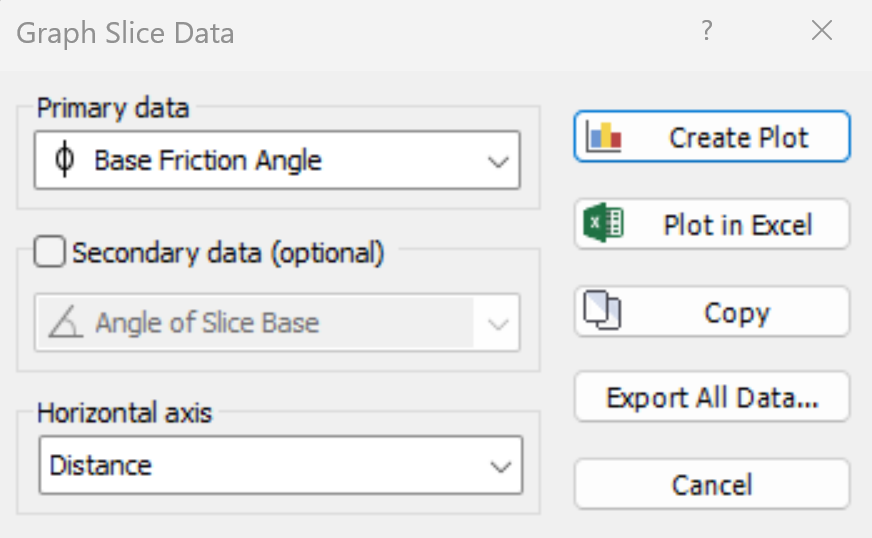
- In Slide2 Interpret, right-click on the surface of interest and select Add Query and Graph.
- The Graph Slice Data dialog will open. Select Export All Data.
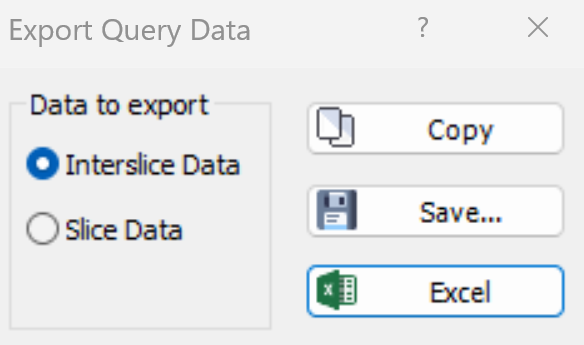
- The Export Query Data dialog will open. Keep the Interslice Data option selected as the Data to Export. Click on Excel.
- Excel will open and you can add up the individual slice weights.
Why do I have negative interslice forces towards the crown of the failure surface?
Interslice tension is a common occurrence in slope stability models with cohesive materials in the upper part of the slope. What this implies is the existence of tension cracks. So to get rid of the tension you need to add a tension crack layer.
See page 222 of Duncan and Wright’s Soil Strength and Slope Stability text for more information. The reference is provided below:
Duncan, J.M. and Wright, S.G. (2005). Soil Strength and Slope Stability, John Wiley and Sons Inc.
Alternatively, rather than add a tension crack manually, for the strength models listed below you can define a tensile strength:
- Mohr-Coulomb
- Undrained (Phi = 0)
- Anisotropic Strength
- Anisotropic Function
- Vertical Stress Ratio
- Discrete Function
- Anisotropic Linear
- SHANSEP
The Tensile Strength option can be very useful for models which exhibit tensile forces between slices or on the base of slices. Large tensile forces in limit equilibrium slope stability analysis usually lead to incorrect solutions and/or numerical problems, and should generally be avoided.
The Tensile Strength option can be used to automatically eliminate tensile forces by adjusting the local factor of safety on a slice so that the effective normal stress is zero on the base of the slice. If tensile forces exceed the tensile strength, a tension crack will automatically be created for the slip surface.
Is it possible to limit the failure surfaces to one material?
Yes, this is possible. For example, if there is a thin layer, a polyline search can be used to restrict the surface generation to that layer.
Carrying out an analysis with a Block Search Polyline defined in the weak layer
Another option is to set materials in which you do not want a failure surface to propagate to have infinite strength.
Slope with a material of infinite strength to limit slip surface location
Can I specify a slip surface that covers the entire slope?
Yes, in Slide2 you can use slope limits to force the surfaces through certain portions of the slope. The slope limits options can be found in the Surfaces > Slope Limits menu. The double set of limits should be used if you know the entry and exit points of the surfaces you're interested in. In the case of a failure surface through the entire slope, specify one set near the toe and the other on the crest of the slope. Note that you can also move the limits by right-clicking on the slope limits (they're the little green triangles on the slope surface).
Is there a way to determine the critical failure surface under static loading conditions, then apply a pseudo-static load to only that failure surface?
The following instructions outline how to import the critical failure surface from a static analysis into a pseudo-static analysis, and run only that failure surface with the seismic analysis:
- In the Interpret window, for the static analysis, right-click on the surface. A menu will pop up with a Copy (Slide2 Modeller Format) option. Choose it.
- Go back to the Modeller using the Modeler option in the Analysis menu or the toolbar.
- In the Modeler, choose the Edit > Paste from Interpret menu option.
- The surface of interest will be imported into the modeller. Delete all other surfaces, grids, etc. Use the right-click functionality to quickly delete the search entities. If you are doing a non-circular search, set the number of surfaces to zero. This is so that only the surface of interest is calculated.
- Add the pseudo-static seismic load using the Seismic Load option in the Loading menu of the Slide2 Modeller.
- Save the file to a new name and run it.
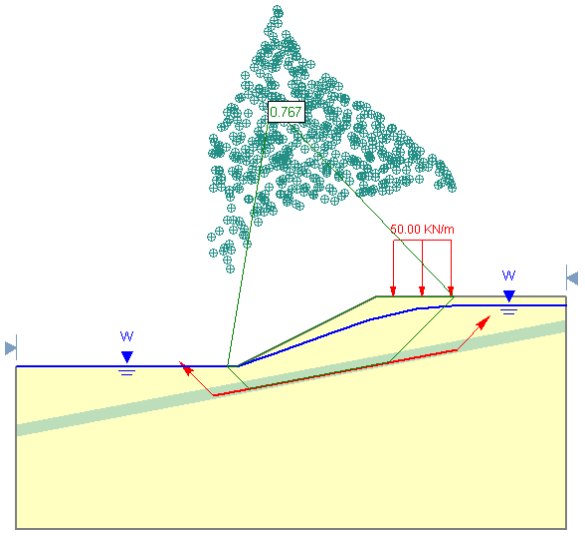
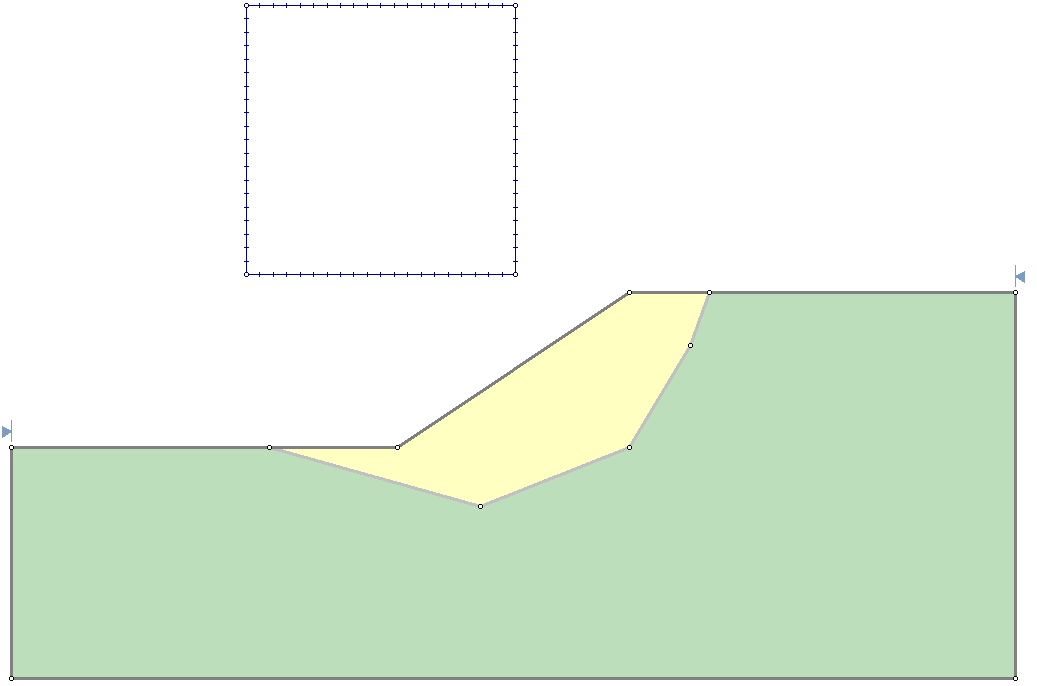
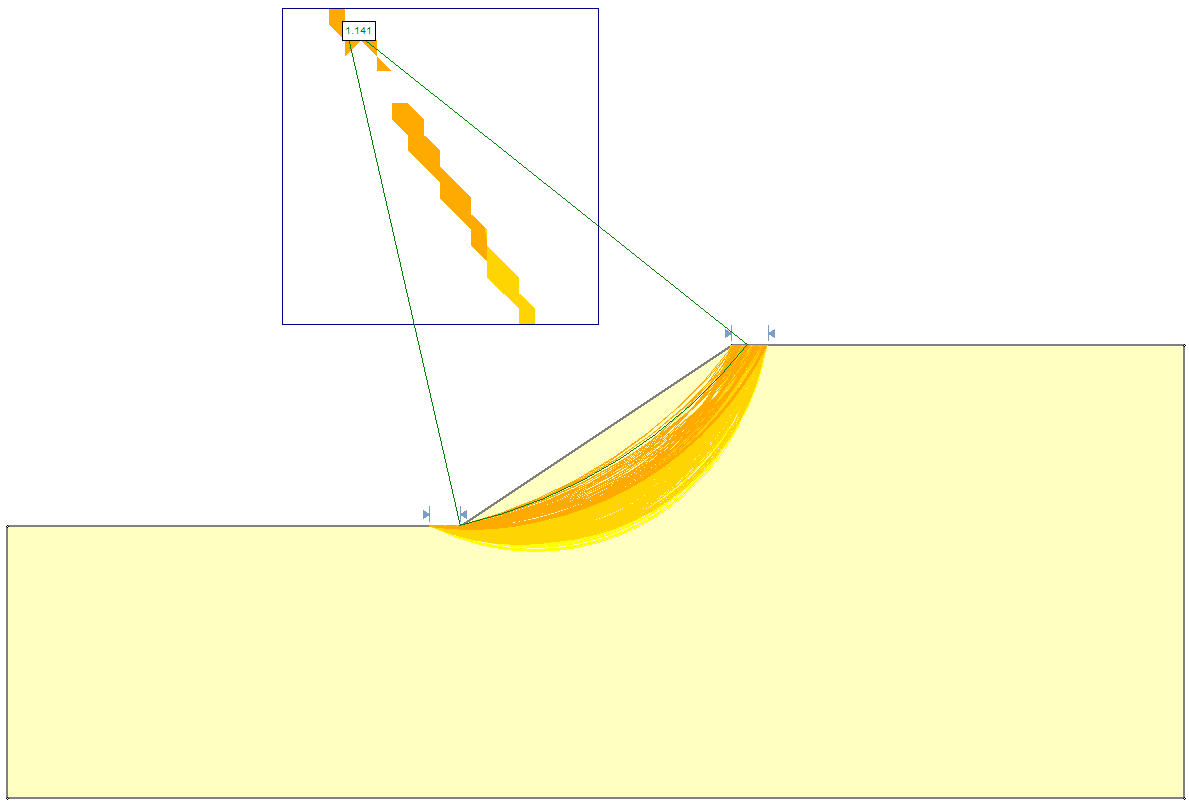
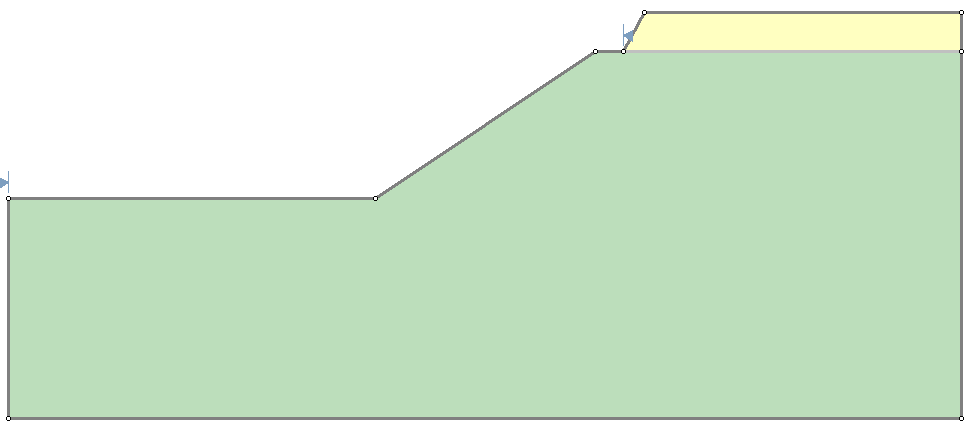
In slope stability calculations does Slide2 consider the influence (in terms of weight) of the upper portion of a model if the limits for the slope are located lower?
No, and this is because of the limit-equilibrium algorithm in general. The algorithm in Slide2 uses the method of slices. The failure surface is divided into a number of these slices. The forces on each slice are only due to external forces on that particular slice and the weight of the slice. There are also interslice forces due to adjoining slices. So, since the yellow material is outside the extent of the failure surface, its weight is not applied in any way to the force system of any surface between the search limits. The analysis is not like a finite-element analysis in which loads have some influence in all directions. If you want something like this, RS2 is the program to use.
How does Slide2 deal with interslice forces in models with anisotropic materials?
Basically, the interslice forces are computed based on the assumptions defined by the method. For example, Spencer's method assumes a constant interslice force angle, and Janbu and Bishop's methods assume no interslice shear stress.
Table 6.2 in Duncan and Wright's book lists the various interslice force assumptions:
Duncan, J.M. and Wright, S.G. (2005). Soil Strength and Slope Stability, John Wiley and Sons Inc.
How can I query surfaces other than the global minimum?
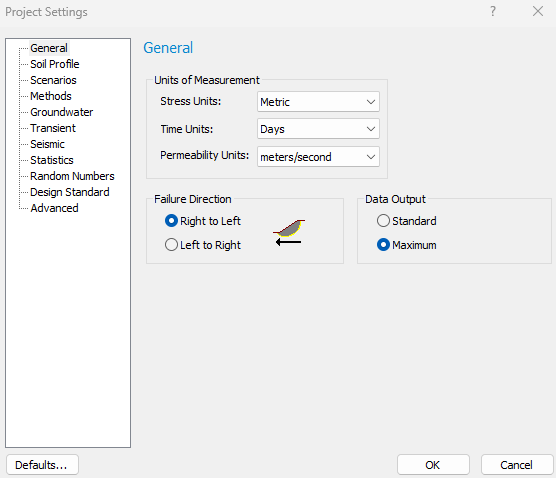
In Slide2 you cannot query any data on a surface other than the global minimum unless the Data Output Mode is set to Maximum in the Project Settings of the Modeller.
If you are using a grid of circular surfaces, even in maximum data mode only the minimum at each grid point is stored. One way to get more surfaces may be to use the maximum data mode with the Auto Refine search method instead of a grid search.
Why are parts of the grid, after computing, left blank?
For each grid point in the grid, by default 10 circular surfaces are generated with different radii. If none of these surfaces converges to a factor of safety, then the contouring in Slide2 will leave the area around this point-blank. The reasons for this vary, but a list of error codes in the InfoViewer usually gives an idea as to the reasons.
Another method to see why a grid point does not generate any valid surfaces is to use the Add Query option in the Query menu. Before using this option, make sure the Query Invalid Surfaces option is on (this is also in the query menu). Then select the Add Query option and move the cursor around the grid. You'll quickly see some text explaining why certain grid points do not generate values.
Now sometimes you'll see a global minimum at a point inside the white region. This is fine and the result is accurate. All this means is that the program could not contour around this point. Most likely because the grid points close to the global minimum do not generate any valid surfaces.
Users should also try some of the other search methods and explore noncircular surfaces as well.
Is there a way to produce a table summarizing specific data for each slice?
A table, and graph, can be generated in Excel by:
1. In the Interpret window, right-click on the global minimum and choose the Graph Query option.
2. In the dialog that comes up, choose the desired Primary data type.
3. Press "Plot in Excel".
To export all slice data:
1. In the Interpret window, right-click on the global minimum and choose the Graph Query option.
2. In the dialog that comes up, choose Export All Data.
3. In the dialog that pops up, choose Interslice Data or Slice Data.
4. Choose Copy, Save, or Excel.
A table of values for the global minimum can also be found in the Infoviewer (in the Analysis menu). In order to query a surface other than the global minimum, the Maximum Data output mode must be turned on in the Project Setting/General tab of the Slide2 Modeller.
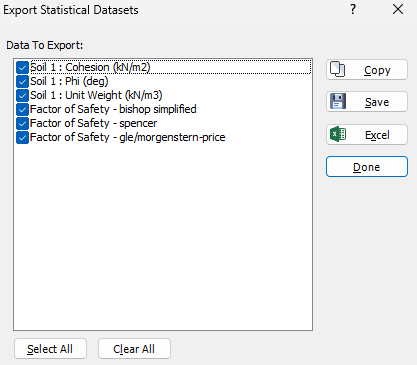
How can I view all combinations of parameters for a probabilistic analysis?
In the Interpreter, the menu option Analysis > Export Statistics Data allows users to export statistical data sets.
Can I use Bishop's method for non-circular surfaces?
Most people do not use Bishop's method for noncircular surfaces because the original Bishop's Simplified method, as described by Bishop in his 1955 paper, assumes that the normal forces on the base of the slip surface pass through the center of rotation. Obviously this is not the case for noncircular failure surfaces and thus people do not use the method for noncircular failure surfaces. However, Slide2 does account for the fact that the normal force does not pass through the center of rotation by calculating the moment arm associated with each normal force. Thus, most of the time, you get reasonable results for most noncircular surfaces.
One of the other issues is that there is an effect of the center of rotation axis location, as seen in Freudland et al. (1992). It also clouds the issue and raises concerns on the validity of the Bishop results.
We recommend using Spencer and GLE since only these methods satisfy both moment and force equilibrium. You can also use Bishop for circular and Janbu for noncircular since they are less prone to convergence issues. Janbu gives a good lower bound for noncircular surfaces. So the bottom line is, we do not recommend using Bishop for noncircular.
Reference
Fredlund, D. G., Zhang, Z. M., & Lam, L. (1992). Effect of the axis of moment equilibrium in slope stability analysis.Canadian Geotechnical Journal, 29(3), 456-465.