Retaining Wall (EFP)
The Retaining Wall (EFP) support type allows you to model a retaining wall by defining an equivalent fluid pressure (EFP) for a given pressure shape, or alternatively a custom pressure profile.
Force Application
See the Force Application topic for a discussion of the significance of Active and Passive support force application in Slide2.
Force Orientation
The default force orientation for the Retaining Wall (EFP) support is Horizontal. However, the following options are available:
- Parallel to Reinforcement
- Tangent to Slip Surface
- Bisector of Parallel and Tangent (i.e. at an angle which bisects the tangent to slip surface orientation, and the parallel to reinforcement orientation)
- Horizontal
- User-Defined Angle (i.e. the user may specify an angle, measured from the positive horizontal direction)
Pressure Profile Type
Four options are available and their respective input parameters are explained below:
Uniform
- Pressure (force/area): this is simply the pressure of the uniform pressure profile.
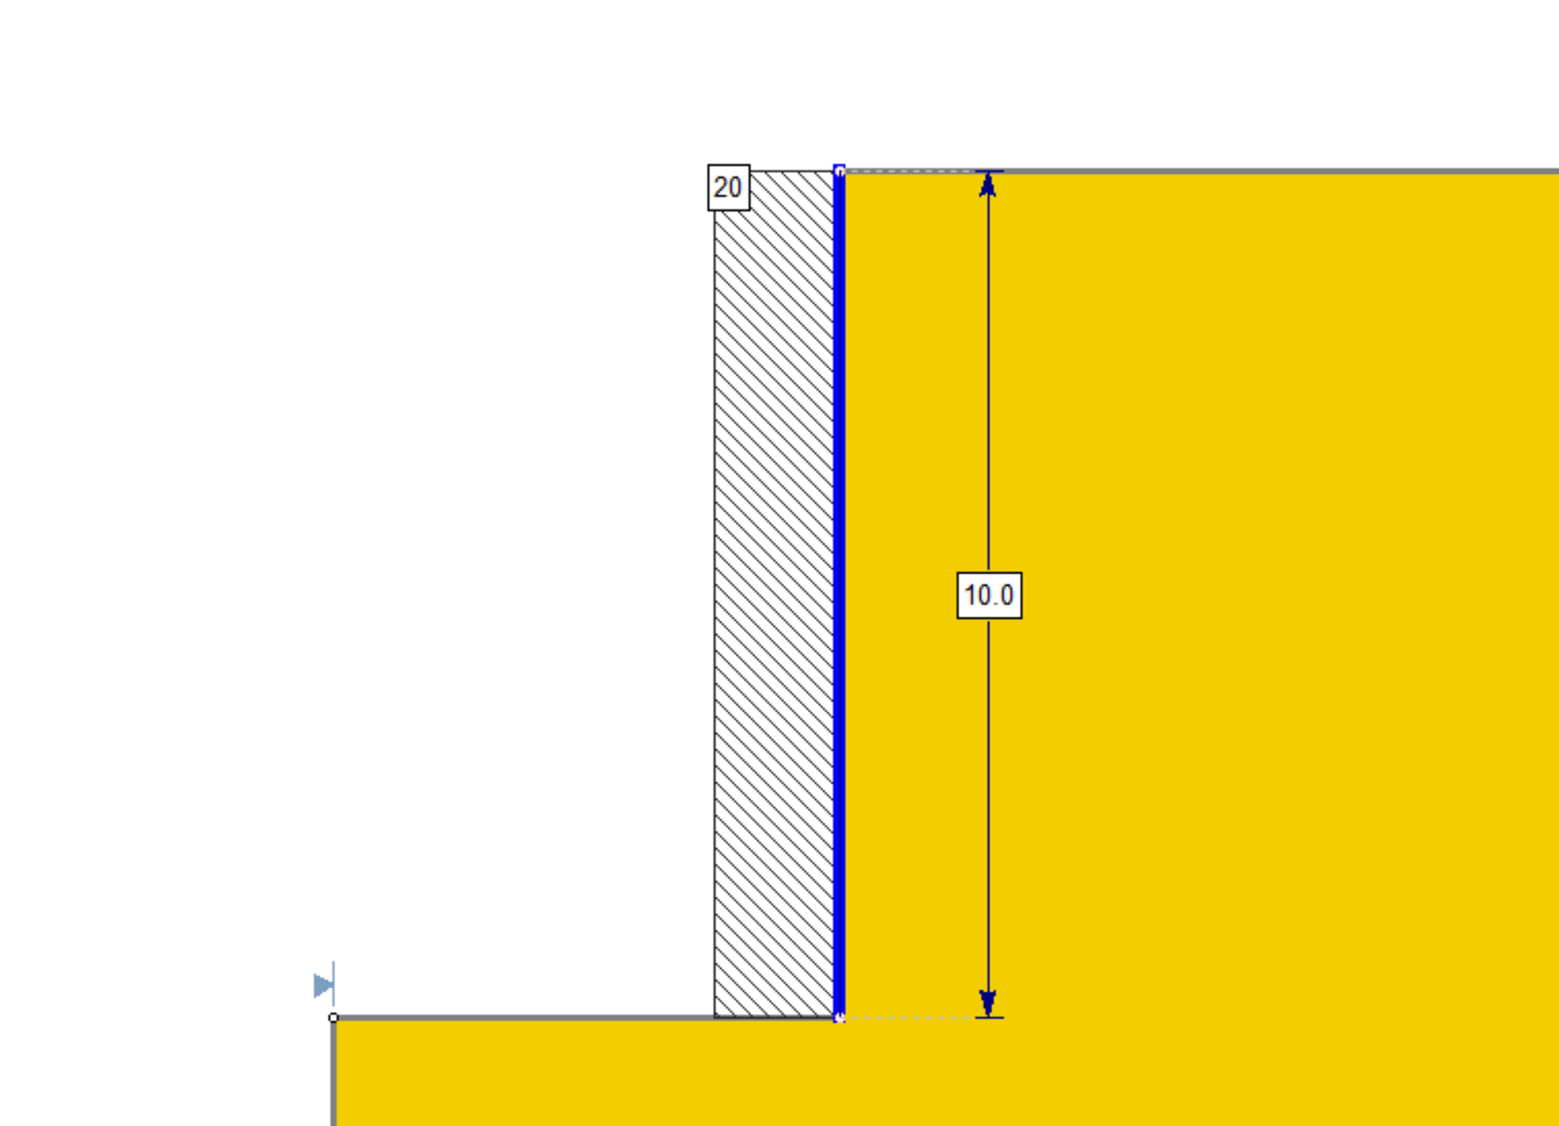
As an example, a pressure input of 20 force/area would have the following pressure profile:
Triangular
- EFP (force/volume): the pressure per unit length of the wall. In this case, this is the slope of the triangular pressure profile.
As an example, an EFP input of 20 force/volume over a 10 unit long wall, would have the following pressure profile:
Trapezoidal
- EFP (force/volume): the pressure per unit length of wall. In this case, EFP x wall length = pressure at flat part of trapezoid.
- Distributed Over (%): the percentage of the length of the wall that makes up the flat part of the trapezoid.
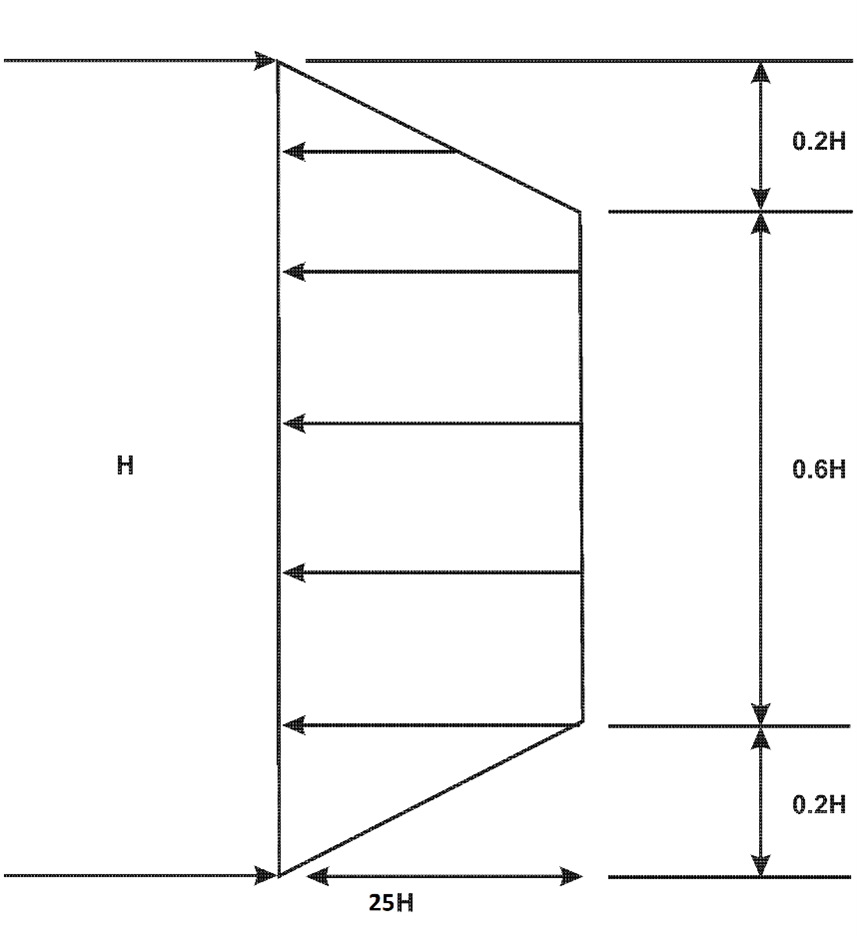
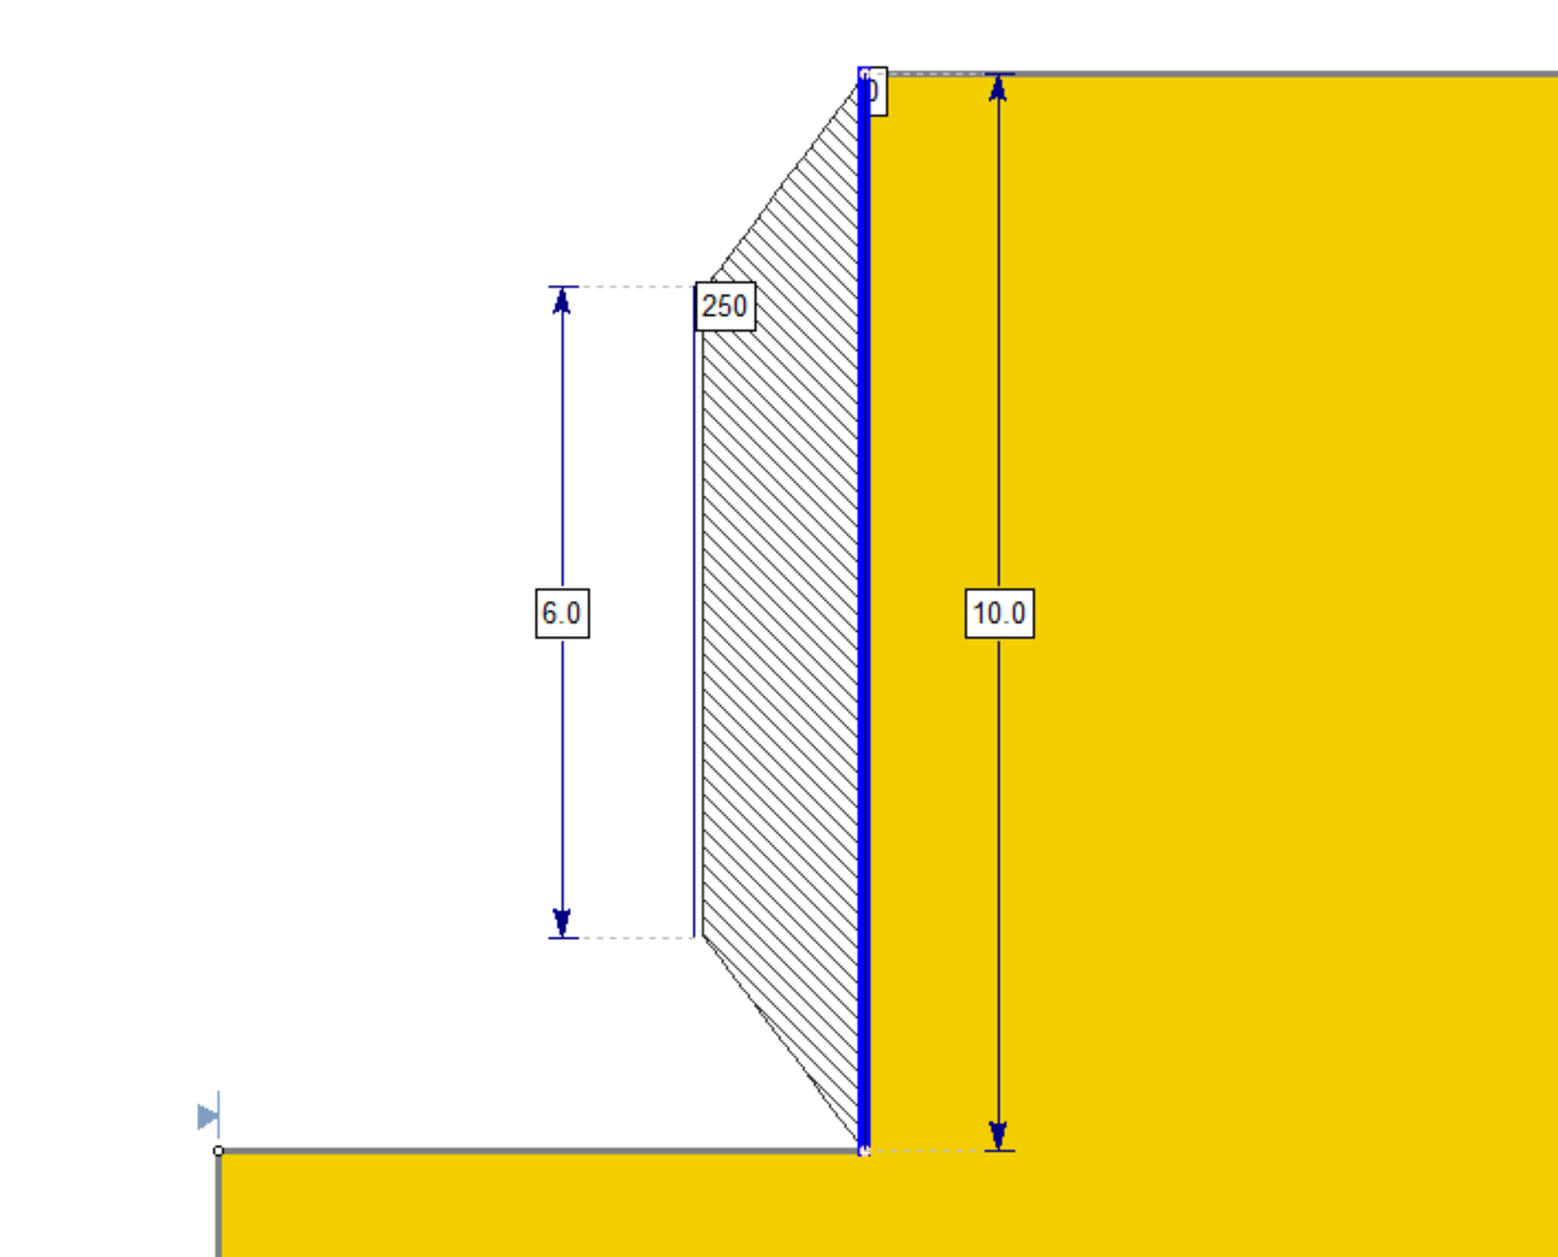
This is best explained using the diagram below, typically of the kind provided to the engineer. In this diagram, EFP = 25 force/volume, such that the pressure at the flat part of the trapezoid is 25H force/area. Distributed Over = 60%.
As an example, an EFP input of 25 force/volume and a Distributed Over of 60%, over a 10 unit long wall, would have the following pressure profile:

Custom
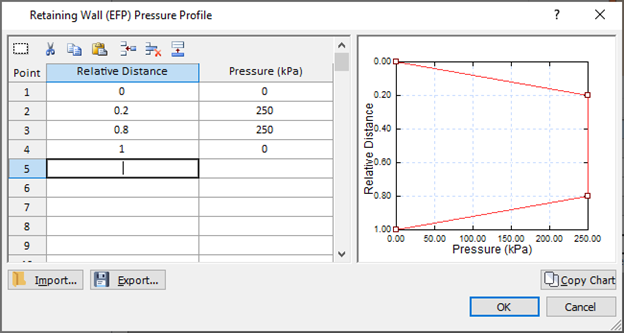
- Custom Pressure Profile: this option allows the user to define their own custom pressure along the wall. Click the “Define” link to define the pressure profile values at each location along the relative length of the wall.
- Note: If a pressure value is not defined at the relative distance of 0, pressure at that point is assumed to be 0. If a pressure value is not defined at a relative distance of 1, the last pressure value in the table is taken as the pressure at 1.
As an example, we can define the same trapezoidal profile from the previous example as shown:
Location of Force
The force can be specified at the slip surface intersection point as with other support options in Slide2. It can also be specified as the centroid of the pressure diagram defined in the dialog above.
Implementation of Retaining Wall (EFP) support in Slide2
The calculation is simple. The pressure diagram is integrated along the length of the wall above the slip surface intersection point to obtain the force. This force is then applied at either the intersection point or the centroid of the pressure profile above the intersection point, per the “location of force” selection by the user. The failure mode is always assumed to be Shear.
Pressure and Force Diagram
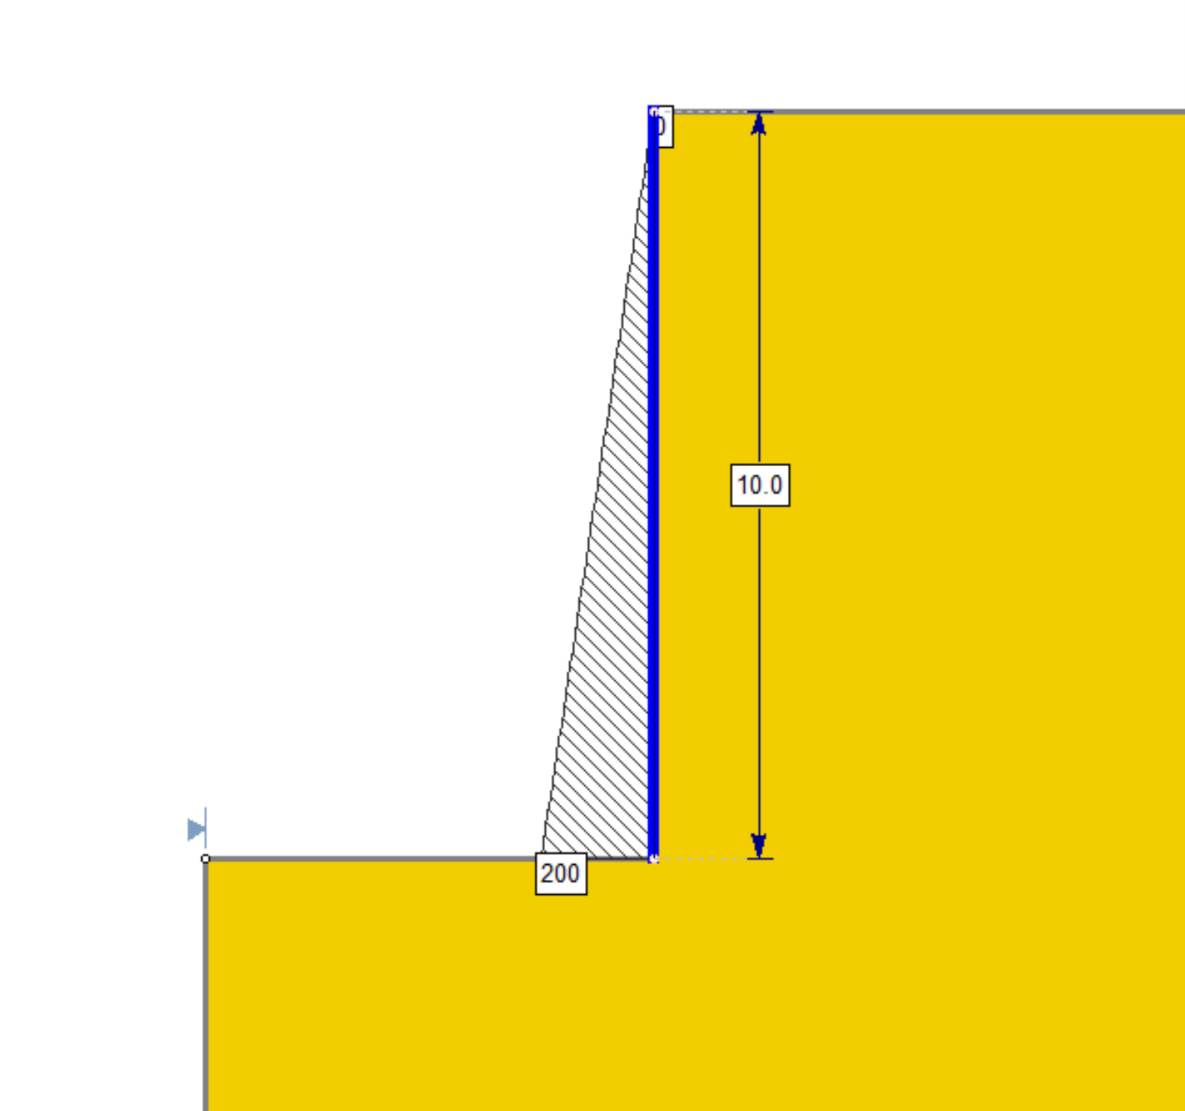
The pressure diagram can be viewed in Interpret by selecting Data > Show Support Pressure Diagram. It would display as follows for the particular pressure profile defined in the image above:
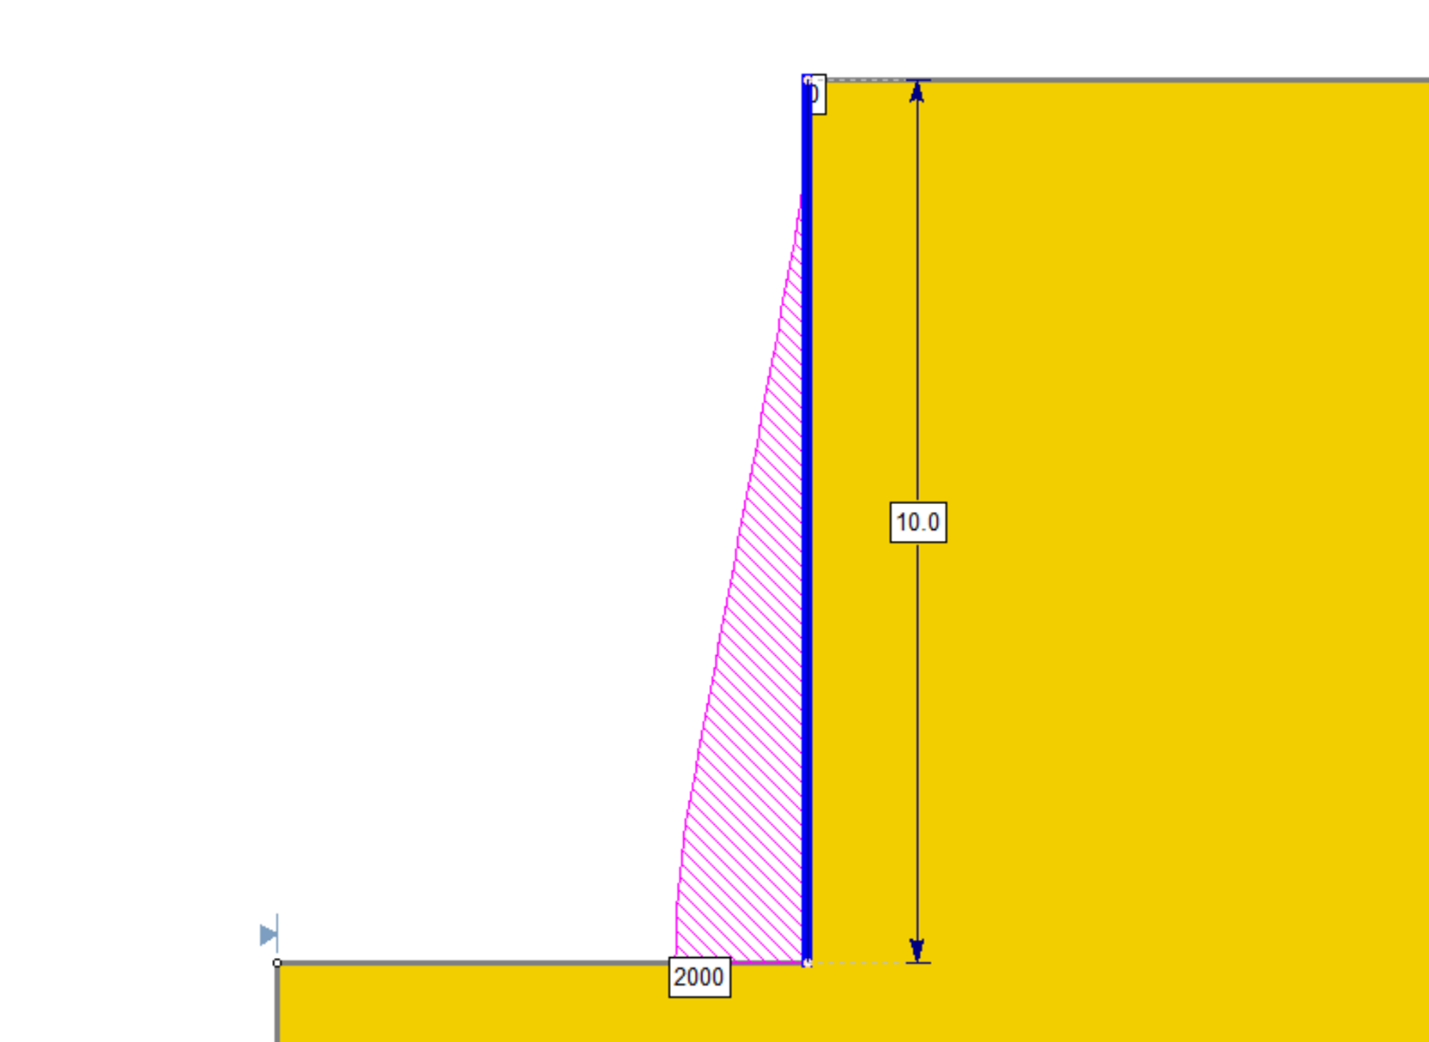
The force diagram can be viewed in Interpret by selecting Data > Show Support Force Diagram. It would display as follows for the particular pressure profile defined in the example above. Note that this is simply the integration of the pressure along the length of the wall. Notice that at the bottom of the support the entire pressure is integrated, resulting in the area of the trapezoid: (10 + 6)/2 *250 = 2000.