Property Viewer
The Property Viewer exists in both the Modeler and Interpreter. In both cases, it can be accessed by selecting Analysis > Property Viewer or by clicking on the icon in toolbar ![]() . It allows the user to visualize cohesion, phi, unit weight, pore pressure, GSI, mi, or D.
. It allows the user to visualize cohesion, phi, unit weight, pore pressure, GSI, mi, or D.
The options available are explained below:
Property Viewer in the Modeller
Property: Select property to view
Filters:
- Show variable and constant: view all contours.
- Show variable only: only view contours of spatially variable materials, or linearly increasing ones.
- Pick materials to show: select specific materials to view.
Spatial Options:
- Sample number: allows you to cycle through the samples of the analysis.
- Show Spatial Grid: view the grid boxes (instead of the interpolated contours) that are actually generated by the field.
- Normalize Spatial Contours: view the contours on a general legend, by their relation to their standard deviation. This is especially useful if you have materials that have very different levels of strength.
Spatial Properties:
This option allows the user to adjust the correlation length values and view the changes to the model in real-time.
- Apply Grid Changes to Model: this box is automatically checked. It indicates that the changes you make here will be applied to the analysis. If you would like to see the effect of the values without changing your inputs in the Statistics dialog, uncheck this box.
- Display Options: the usual Display Options are also found here.
TOOLBAR OPTIONS:
Two additional options can be found in the toolbar. The Open New Property Viewer button ( ) allows the user to open a new instance of the property viewer for this model. This is particularly useful if you want to see two different properties at the same time (such as cohesion and phi for example) that are correlated. The views can then be tiled, and the Synchronize Property Viewer button (
 ) would allow you to cycle through samples of both instances at once, and check or uncheck options in the Property Viewer Options for both instances.
Property Viewer in Interpreter
The Property Viewer in Interpret contains all of the options found above, with the addition of the following options:
Analysis Method: Select the analysis method to view.
Draw Global Minimum Surface for Sample: this option is checked off by default. It allows the user to see the corresponding global minimum surfaces associated with each sample. As you cycle through the samples, this surface changes.
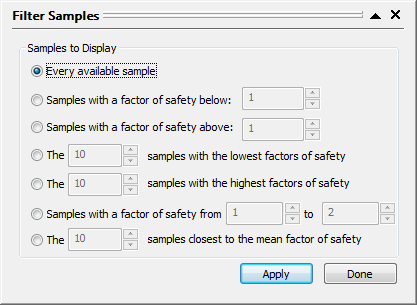
Filter the Samples that can be viewed (![]() ): used to filter out the samples that are viewed by various different criteria.
): used to filter out the samples that are viewed by various different criteria.
Show that sample that gives the minimum factor of safety (![]() ): displays the sample with the lowest factor of safety.
): displays the sample with the lowest factor of safety.
Export Spatial Data
If any materials have Cohesion, Phi, and/or Ks defined as spatial in the statistics dialog, the option to export these parameters will be available from the Property Viewer, both in the Modeller and Interpreter.
If Cohesion and/or Phi is defined, the option to export spatial samples to a discrete function will be available in the Property Viewer menu by selecting File > Material Spatial > Export Sample as Discrete Function or File > Material Spatial > Export Multiple Samples as Discrete Function.
If Ks is defined, the option to export spatial samples to a Ks grid will be available in the Property Viewer menu by selecting File > Hydraulic Spatial > Export Sample as Ks Grid or File > Hydraulic Spatial > Export Multiple Samples as Ks Grid.
Exporting a Single Sample
When choosing Export Sample as Discrete Function or Export Sample as Ks Grid, a single file will be created with all of the associated spatial data based on the currently selected sample in the Property Viewer. It will be necessary to select which material’s spatial data should be exported.
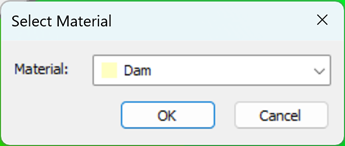
The material options shown in the above dialog will only be materials with relevant spatial data.
Exporting Multiple Materials and Samples
When choosing Export Multiple Samples as Discrete Function or Export Multiple Samples as Ks Grid, a single file will be created for each selected material which will contain all of the associated spatial data for each sample in the selected range. The material and samples should be selected in the following dialog:
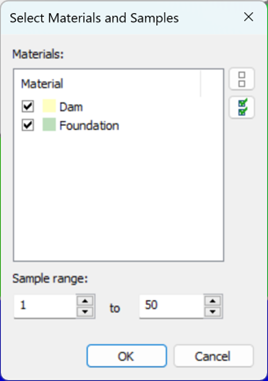
The material options shown in the above dialog will only be materials with relevant spatial data. The range will by default be set to the maximum range. The minimum sample number must be less than or equal to the maximum sample number, and greater or equal to 1. The maximum sample number must be less than the maximum number of samples defined in the Project Settings.
Query Line
The Add Query Line option allows the user to define a query anywhere on the model, to obtain data anywhere within the External Boundary of the model. The data which is generated by the query will correspond to the contoured data which is currently being viewed (e.g. Cohesion, Phi, Ks, etc). This option to query any parameters will be available from the Property Viewer, both in the Modeller and Interpreter.
A query can consist of:
- a single point
- a single line segment
- an arbitrary polyline with any number of line segments
To create a query with the Add Query Line option:
- Select Edit > Add Query Line the menu or click Add Query Line
 in the toolbar.
 - You will be prompted to enter the points defining the query. Use the mouse to enter points graphically, or enter x,y coordinate pairs in the prompt line.
TIP: The Snap options can be useful for entering a query graphically since you can snap exactly to vertices, boundaries etc.
- When you have finished entering points, press Enter, or right-click and select Done, and you will see the Specify Query Locations dialog. In this dialog, the three Generate Values options provide different ways of defining the intervals for generating the values along your query line.
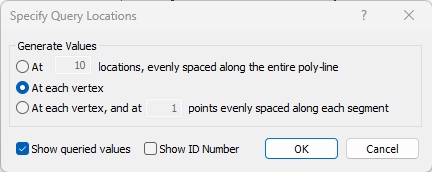
Keep in mind that the descriptions in the Specify Query Locations dialog refer to an arbitrary polyline with any number of line segments. The term "vertex" refers to vertices of the polyline, which will not necessarily correspond to boundary vertices. If your query consists of only a single line segment, then only the first Generate Values option is applicable.
- When you are finished with the Specify Query Locations dialog, select OK.
- The query will be added to the model.
- The interpolated values will be generated for your query, according to the Generate Values method chosen.
- The queried values and/or the query ID number will be displayed on the query if you selected these checkboxes in the Specify Query Locations dialog.