Profile Plots
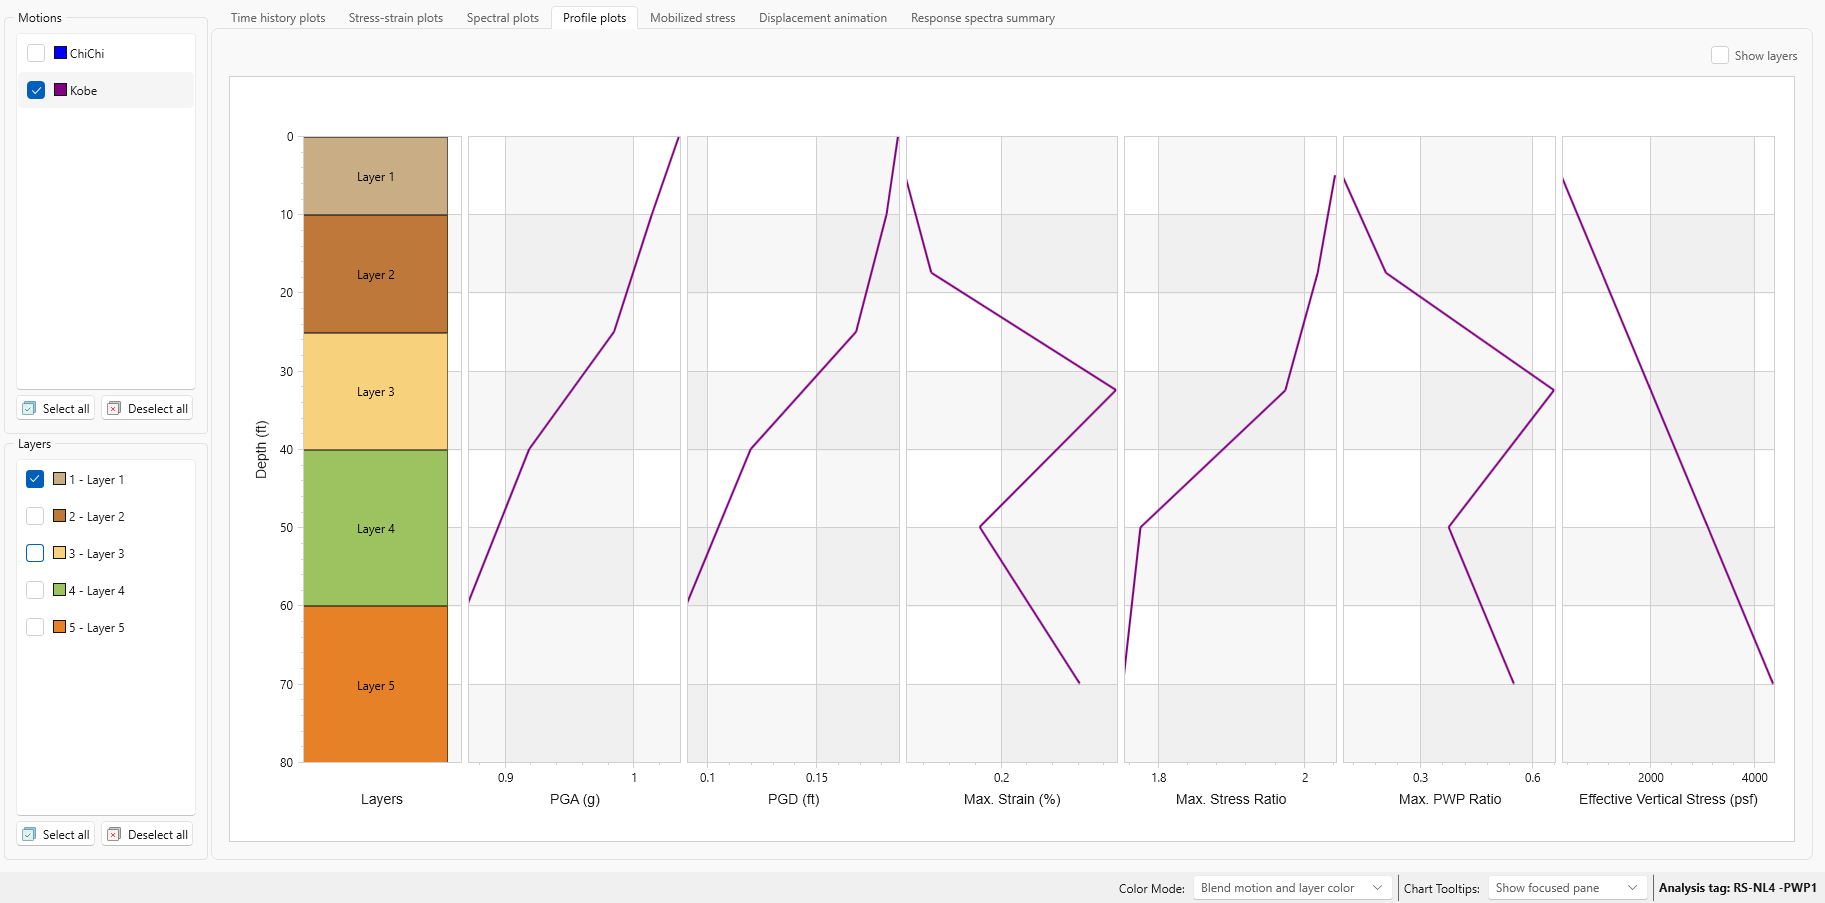
The Profile plots show the variation of various parameters as the ground motion is propagated through the soil profile. For example, the maximum strain profile shows the level of strains experienced in the various layers. In this tab, the user can see the following plots:
- PGA
- PGD
- Max Strain
- Max Stress,
- Max PWP Ratio (if applicable)
- Effective Vertical Stress