Time History Plots
In the Time History Plots tab, the user can see the following plots:
- Acceleration
- Relative Velocity
- Relative Displacement
- Arias Intensity
The relative velocity/displacement is calculated by subtracting the total velocity/displacement at the top of rock from the total velocity/displacement at the middle of the target layer. The total velocity and total displacement are provided in the project output folder.
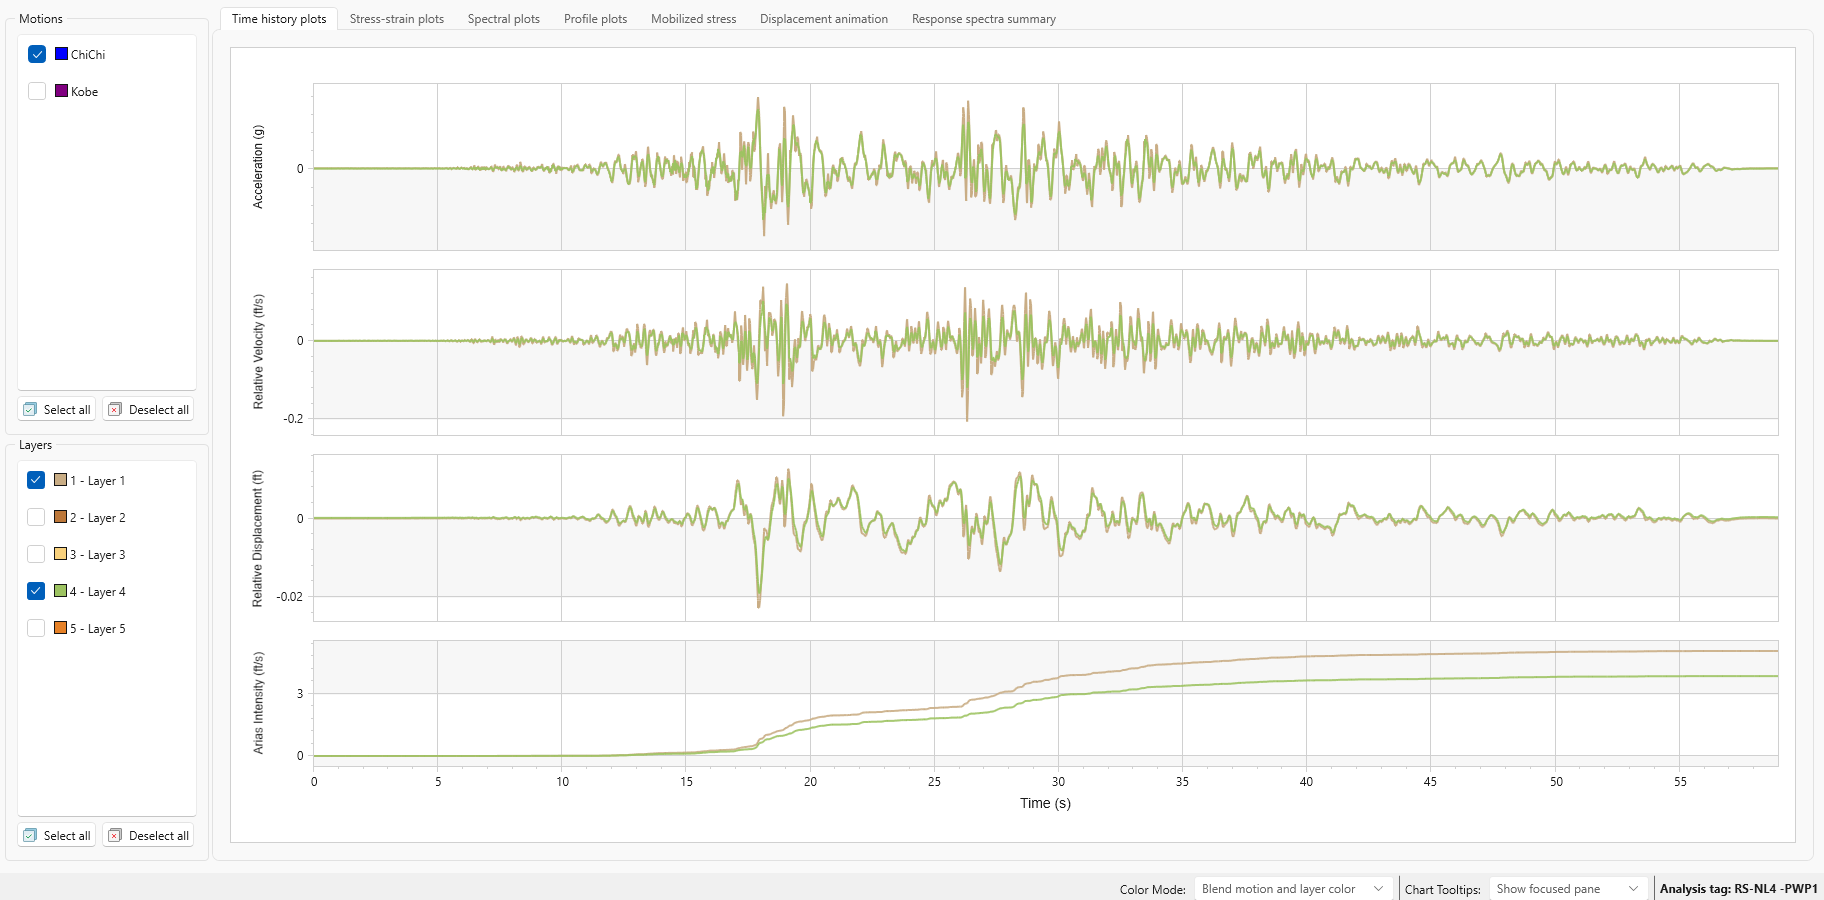
Using the checkboxes on the left of the screen, the user can select the Motions and Layers to be displayed.
The color of the layer and motion plots can be adjusted for easier viewing using the Color Mode drop down in the bottom left of the screen.
To export these charts and their data as an excel file, use the Chart in Excel option in the toolbar.