Profile Plots
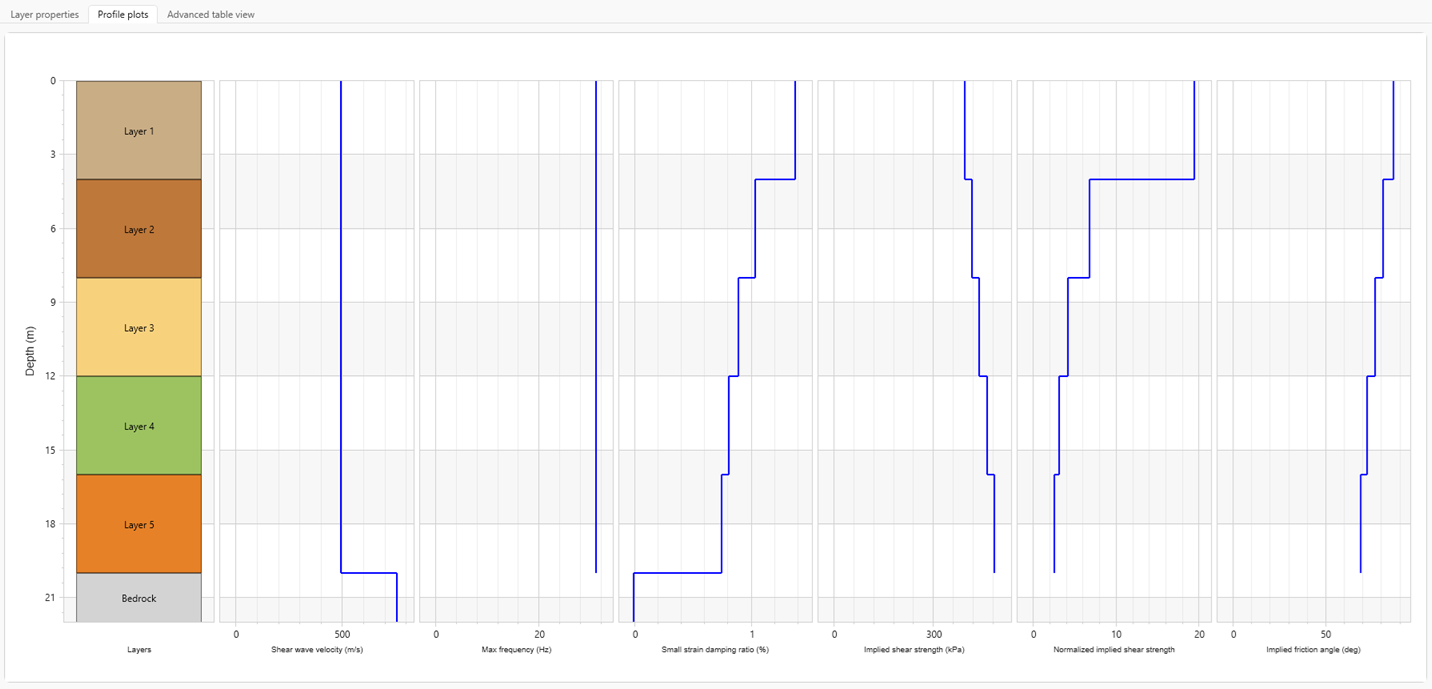
The Profile Plots tab allows users to review their data entered for their soil profile in chart form. The plots are shown along side the soil layers for easy review of the data. The following plots are available:
- Shear wave velocity
- Max frequency
- Small strain damping ratio
- Implied shear strength
- Normalized implied shear strength
- Implied friction angle
Maximum Frequency
For time domain analyses, upon completing the definition of the soil and model properties, the user is shown a plot of the maximum frequency versus depth for each layer. A plot of maximum frequencies (Hz) versus depths of all layers are displayed. The maximum frequency is the highest frequency that the layer can propagate and is calculated as: fmax = VS / 4H, where VS is the shear wave velocity of the layer, and H is the layer thickness. To increase the fmax, the thickness of the layer should be decreased. This check is performed solely for time domain analyses. It is recommended that the layers have the same maximum frequency throughout the soil profile, though this is not required. For all layers, the maximum frequency should generally be a minimum of 30 Hz.