Search Results

Chart Properties

The Chart Properties option in RSSeismic allows you to customize several properties in the displayed chart, including those specific to the chart as a whole, the X-Axis and the Y-Axis. The options vary depending on the chart being displayed but can include:

  • Title visibility
  • Margins
  • Markers and Lines
  • Font size/style
  • Colours
  • Value Labels
  • Axes

chart properties

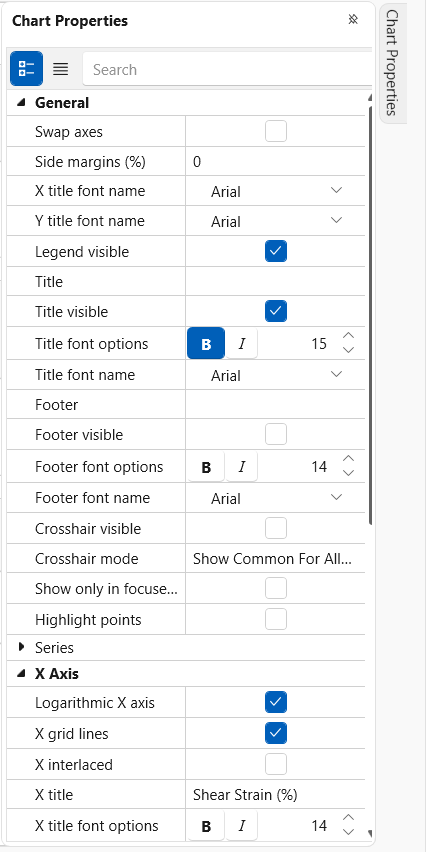
To access the Chart Properties, click on the pop out menu on the left of the screen (labelled Chart Properties).

Changes to Chart Properties are only applied to the active plot.
Rocscience logo, click here to return to the homepage Portal Account Portal Account Log In Log Out Home Shopping Cart icon Click here to search our site Click here to close Learning Tech Support Documentation Info Chevron Delete Back to Top View More" Previous Next Edit PDF File Calendar Location Language External Link Apply to ACC External Link Fees Video Click here to visit Rocscience's LinkedIn page Click here to visit Rocscience's YouTube page Click here to visit Rocscience's X page Click here to visit Rocscience's Facebook page Click here to visit Rocscience's Instagram page Click here to visit Rocscience's Reddit page Bookmark Network Scroll down for more Checkmark Download Print Back to top Single User Multiple Users RSLog RocFall3 CPillar Dips EX3 RocFall RocPlane RocSlope3 RocSupport RocTopple RS2 RS3 RSData RSPile RSWall RSSeismic Settle3 Slide2 Slide3 SWedge UnWedge RocTunnel3 RocSlope2 BlastMetrix ShapeMetriX FragMetriX TestLicense Commercial License Education License Trial License Shop safe & secure Money-back guarantee