Motion Pair View
A selected motion pair can be reviewed in a separate window using the Motion Pair View. The Motion Pair View can be opened by:
- Selecting the Bi-directional mode in the upper right corner of the Motion Manager
- Right-clicking a Motion pair in the list of available ground motion pairs and selecting Motion Pair View
- Clicking the Motion Pair View option in the toolbar and selecting the Motion Pair from the drop down list
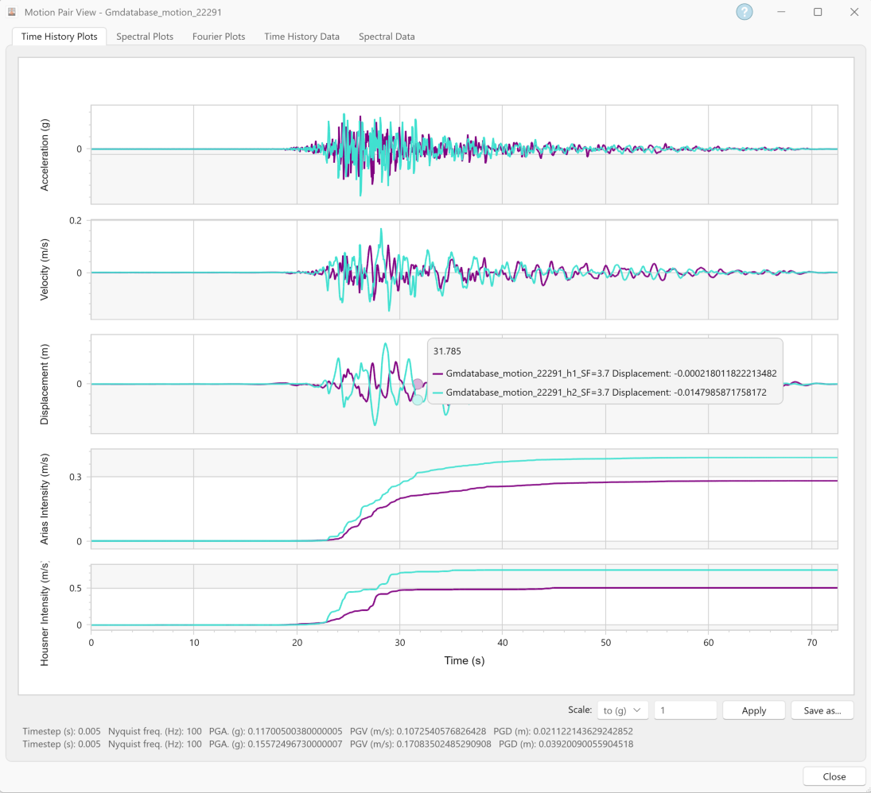
The dialog is comprise of five tabs:
- Time History Plots
- Spectral Plots
- Fourier Plots
- Time History Data
- Spectral data
Under Time History Plots the user has the option to linearly scale the selected input motion pair. The user is provided two options for scaling: scale each of the original motion pairs by a specified factor (scale by) or scale the original motion pair to a specified maximum acceleration (scale to). The desired method can be selected using the drop-down list in the bottom right corner of the dialog. Click on the Apply button to scale the motion pair and recalculate the other data. After scaling, the user can save the new motion by pressing Save As.
In the Spectral Plots tab, geometric mean of response spectra and smoothed Effective Amplitude Spectra (EAS) are available:
The geometric mean of response spectra can be calculated with any of the response spectrum calculation approaches below:
- Frequency Domain
- Time Domain - Duhamel Integral
- Time Domain - Duhamel Integral with Timestep Correction (zero-padded in frequency domain)
- Time Domain - Newmark Beta Method
- Time Domain - Newmark Beta Method with Timestep Correction (zero-padded in frequency domain)
The EAS is calculated as the square root of half the sum of the squares of the Fourier amplitude spectra components. The motion pair view also provides the ability to modify the bandwidth parameter for the Konno & Ohmachi (1988) smoothing approach used as part of the
Fourier amplitude and phase angle plots are presented in Fourier Plots tab for both of the components of the ground motion pair
The calculated data is also provided in data tables which can be accessed by selecting the Time History Data or Spectral Data tabs. This also includes the geometric mean of response spectra and EAS for the selected ground motion pairs.