Dobry/Matasovic Model for Sand
The Matasovic (1992) pore water pressure generation parameters must be determined by a curve-fitting procedure of cyclic undrained lab-test data. Once the data is obtained, the following equation, proposed by Matasovic and Vucetic (1993, 1995), can be used to determine the best-fit parameters to be used in the analysis.
The excess pore water pressure is generated using the following equation:
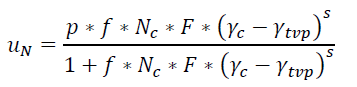 | Eq. 1 |
Table 1: Description of Dobry/Matasovic Model Parameters
| VARIABLE | DESCRIPTION |
| uN | Normalized excess pore pressure (ru) |
| Neq | Equivalent number of cycles |
| γc | The current reversal shear strain |
| γtvp | Threshold shear strain value |
| p | Curve fitting parameter |
| s | Curve fitting parameter |
| F | Curve fitting parameter |
| f | Dimensionality factor |
| v | Degradation parameter |
The uN parameter is defined as the normalized excess pore water pressure ratio (ru = u’ / σv’).
Neq is the equivalent number of cycles calculated for the most recent strain reversal. For uniform strain cycles, the equivalent number of cycles is the same as the number of loading cycles. For irregular strain cycles, since the cycle number does not increase uniformly, Neq is calculated at strain reversals using the uN obtained from the previous step and is then incremented by 0.5 for the current step.
γtvp is the shear strain value below which reversals will not generate excess pore water pressure.
f is used to account for loading in multiple dimensions. f = 1 is used for 1D motion. f = 2 is used for 2D motion. Note that assigning a value of f = 2 does not double the excess pore water pressure, because f is included in both the numerator and denominator of the equation.
F, s, and p are the curve fitting parameters and can be obtained from laboratory tests.
The degradation parameter, v, is discussed in further detail in the Pore Water Pressure Dissipation topic.
Suggested Values
Carlton (2014) presents empirical correlations for the curve fitting parameters F and s for sands. The best data fit is shown in Figure 1 and have the following functional forms:
| 𝐹=3810 ∗ 𝑉𝑠(−1.55) | Eq. 2 |
| 𝑠=(𝐹𝐶+1)0.1252 | Eq. 3 |
where Vs is the shear wave velocity in m/s and FC is the percentage of fines content. The fit is produced using the data from the table below.
The table below shows that the values of p range within +-7.1% of 1 for different types and relative densities of sands. For practical purposes, p = 1 is often assumed in the absence of laboratory data.
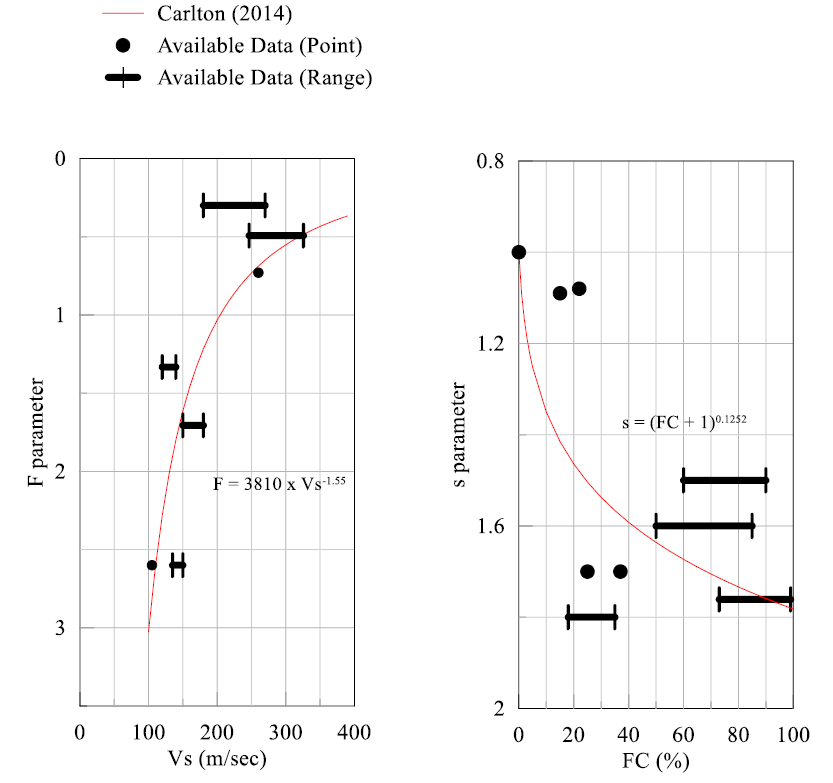
Table 2: Material Parameters for Low Plasticity Silts and Sands for the Matasovic and Vucetic (1993) pore pressure generation model (from Carlton, 2014)
Material |
Reference |
k (ft/sec) |
Pore Water Pressure Model Parameters |
|||||
v |
f |
p |
F |
s |
γtv (%) |
|||
Warrenton, Oregon Silt recovered from 130 to 248 ft b.g.s; 73%<fines<99%; 32.9%<water content<37.3%; 86.3<γdry< 88.9 pcf;882< Vs<1086 fps; OCR = 1.0; PI = 10, LL = 37 |
Dickenson (2008) |
not reported |
1 |
1 |
1 |
0.493 |
1.761 |
0.06 |
Stillaguamish River Silt, Washington; recovered from 30 to 95 ft b.g.s; 60%< fines< 90%; 600ft<Vs<900 ft/s; PI=8-10; LL=31-32 |
Anderson et al. (2010) |
not reported |
not reported |
2 |
1.05 |
0.3 |
1.5 |
0.02 |
Bangding Sand (BS); poorly- graded commercially avaliable sane; Dγ=40%;Dγ=0.19;Cc=0.9;Cu=1.4;γd,min = 90pcf;γd,max=106pcf |
Dobry et al. (1985) |
5.5x10⁻⁴ |
1 |
1 |
1 |
10.9 |
1 |
0.017 |
Wildlife Site Sand A(WSA); void ratio 0.84 to 0.85; 37% fines; N≈5;Vs≈350ft/s |
Vucetic and Dobry (1988) |
9.8x10⁻⁴ |
1 |
2 |
1.04 |
2.6 |
1.7 |
0.02 |
Wildlife Site Sand B(WSB); void ratio 0.74 to 0.76; 25% fines; N≈6 to 13;Vs ≈ 450 to 500 ft/s |
Vucetic and Dobry (1988) |
6.6x10⁻³ |
1 |
2 |
1.04 |
2.6 |
1.7 |
0.02 |
Heber Road Site Sand PB; void ratio 0.7; 15% fines; Vs ≈ 500 to 600 ft/s |
Vucetic and Dobry (1989) |
1.4x10⁻⁴ |
1 |
2 |
1.05 |
1.706 |
1.09 |
0.024 |
Heber Road Site Sand PB; void ratio 0.7; 22% fines; Vs ≈ 400 to 466 ft/s |
Vucetic and Dobry (1990) |
3.9x10⁻⁵ |
1 |
1 |
1.071 |
1.333 |
1.08 |
0.022 |
Santa Monica Beach Sand(SMB); clean uniform beach sand similar to Monterey No. 0; void ratio = 0.56; zero fines; dense; Vs ≈ 867 ft/s |
Matasovic (1993) |
3.3x10⁻¹ |
3.8 |
1 |
1 |
0.73 |
1 |
0.02 |
Owi Island Sand at depths from 6 to 14 m b.g.s.; silty fine sand placed as hydraulic fill; 18% <fines<35% |
Thilakaratne and Vucetic(1987) |
6.6x10⁻³ |
1 |
2 |
1.005 |
3 |
1.8 |
0.025 |
Owi Island Sand at depths of 6 m; placed as hydraulic fill; 50% <fines<85% |
Thilakaratne and Vucetic(1988) |
9.8x10⁻⁴ |
1 |
2 |
0.95 |
2.5 |
1.6 |
0.015 |
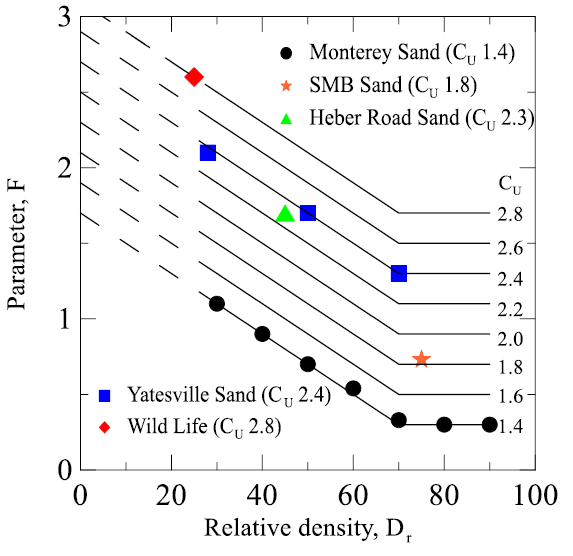
Mei et al. (2015) developed correlation for the curve fitting parameter F using 123 cyclic shear test results compiled from literature. Two soil index properties, relative density (Dr) and uniformity coefficient (Cu) are used in the correlation and it is applicable to sub-angular to sub-rounded clean sands.