Response Spectra Summary
In the Response Spectra Summary tab, the user can see a plot of the Peak Spectral Acceleration for the motion as well as the selected layer(s). The response spectra plot shows the surface and input motion spectra allowing the user to examine how the soil column modified the ground motion.
If more than one motion is being used, use the drop down list in the top left of the screen to select the motion to view.
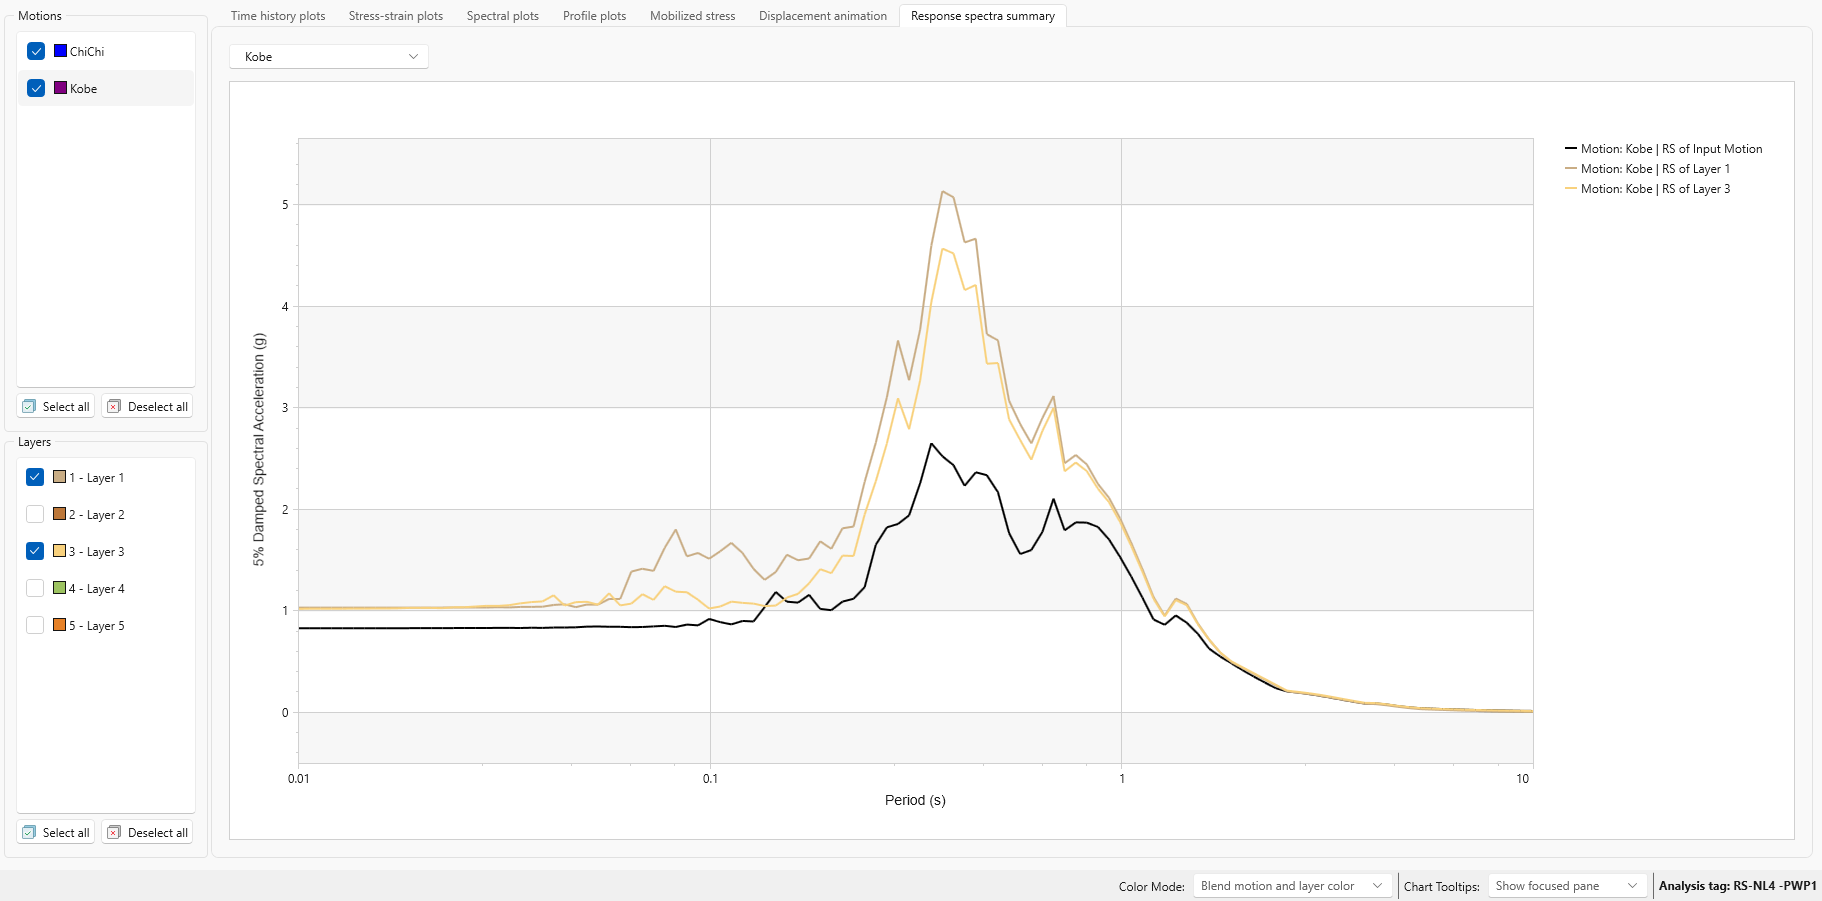
Use the checkboxes on the left of the screen to select the Layers to be displayed.
The color of the layer and motion plots can be adjusted for easier viewing using the Color Mode drop down in the bottom left of the screen.
To export these charts and their data as an excel file, use the Chart in Excel option in the toolbar.