Log Template Design
Creating a log template is made easy with RSLog. To learn how to open the list of log templates and to create, copy or preview a log template please see this documentation page.
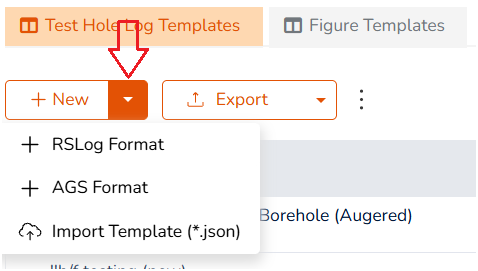
To begin, head over to Reporting and Report Templates and click +New split button to open the menu. Then select AGS Format option:
This will open a new page that allows you to design the following:
- General settings pertaining to your log template,
- Customization of the header/footer (page layout) of your log, and
- Select log columns you would like to show on your log template.
This article provides instructions regarding adding AGS log columns to your log template.
Adding a Log Column
Adding log columns to your template is done by using the +New button under the Log Columns section:
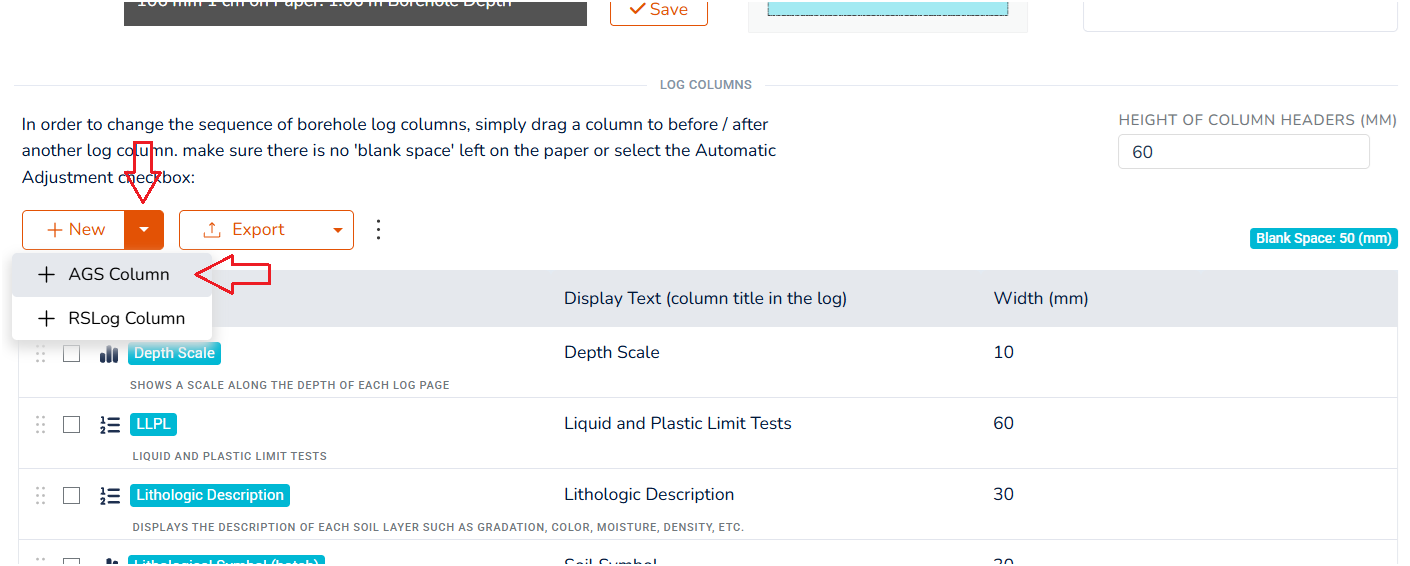
The + RSLog Column option allows adding a general log column that is not necessarily an AGS-driven column; Examples include 'depth scale' or 'elevation scale' columns. To add an AGS-driven log column select the + AGS Column option. This type of log columns allow you to select multiple sub-columns for an AGS group in a single log column. Clicking the + AGS Column option opens a dialog box:
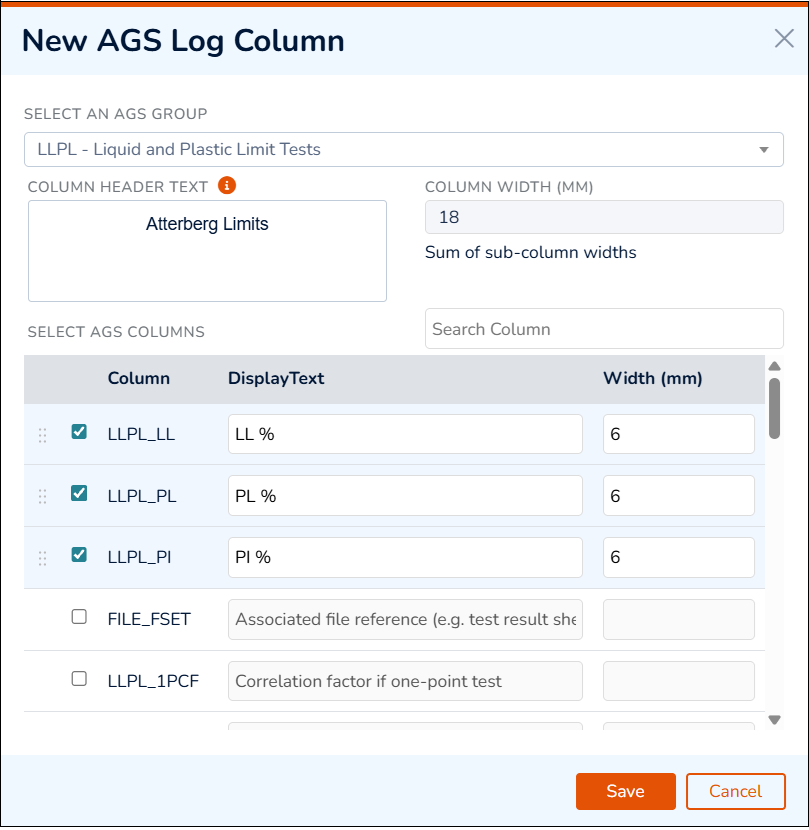
The Select an AGS Group dropdown shows a complete list of AGS standard groups. Once an AGS group is selected, the list of its standard columns will be populated in the list of Select AGS Columns.
The selected columns in that group will be moved to the top of the list for easy access. These selected columns will form sub-columns of that log column in the borehole log. Enter Display Text and Width for each selected sub-column. To re-order the sub-column, use the handle on the left of each row. Click Save button to close the dialog box.
About RSLog Columns
The + RSLog Column option allows adding a general log column with the following options:
- Layer Elev/Depth Bar: shows a horizontal line at the bottom of each stratum showing the elevation and depth values,
- Lithologic Description: linked to the GEOL group → DESC column,
- Lithological Symbol (hatch): linked to the GEOL group → LEG column,
- Atterberg Limits & Moisture Graph: linked to the LLPL group → LL, PL, PI columns,
- Depth Scale: shows the depth in a log column, and
- Elevation Scale: shows the elevation in a log column.