Header/Footer Designer
This page provides help with designing the header and footer of your report templates. Watch the tutorial video and explore further details in the article below.
Getting Started
The header and footer of your templates contain various 'Elements':
- Drag an element from the top toolbar (see below screenshot) and drop it at the desired location on the header or footer area.
- Select an element by clicking on it, then edit properties of that Element using the left property grid (see below screenshot).
- Select multiple elements by drawing a box and right click for more options.
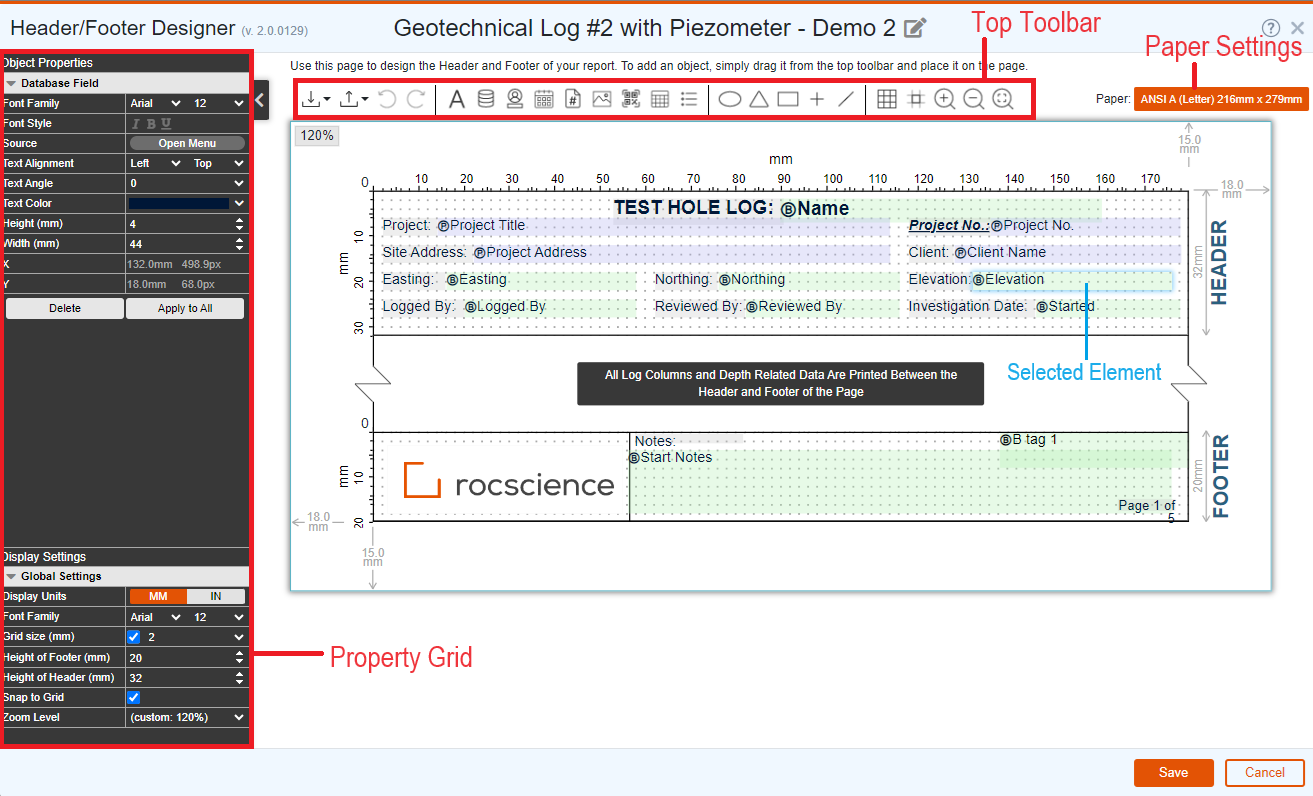
The following screenshot describes various components of the Header/Footer Designer page:
List of Elements
The following elements can be added to the header or footer of the template by dragging the element from the top toolbar, and dropping it on the desired location:
- Label: is used to add a static label in your reports. In Header/Footer Designer, labels are shown with a light grey background.
- Database Field: reads data from your project or test hole, and displays the value on the report. The Database Fields are shown in light green (for borehole) or light purple (for project) background. The prefix Ⓑ or Ⓟ at the beginning of a Database Field element indicates the data is coming from Borehole or Project.
- Username: prints the username in the report. This is the username of the user who generates the report.
- Date: prints the current date at the time of generating the report.
- Page Number: shows the page number. Please check the Format and Numbering properties of this element for additional settings.
- Photo / Logo: is used to insert the company logo or any other photo in the template.
- QR Code: insert a QR code on your report template and specify the target web address (e.g. link to your website or to download the geotechnical report etc). QR Code is a machine-readable optical label that can contain information about the item to which it is attached. This can be scanned by a cell phone or tablet and directs the user to a webpage.
- Table: shows a table in the header or footer. Once added, click on a cell to edit its data.
- List: use this element to show the list of Sample Types or Drilling Methods on the header of footer area. Once added, use the Source and Display Columns properties to format the element.
- Shapes: add basic geometric shapes to use on your report. Once added, use the Height and Width properties to resize the shape.
Once an element is added to the header or footer, it could be moved by selecting the element and dragging it to the desired location. Resizing may be done by mouse or using the Height and Width properties.
Property Grid
The property grid is located on the left side of the page and comprises of two parts:
- Element Properties: once an element is selected, the upper portion of the property grid shows the settings of that element (e.g. font style, colors, size, etc). The property grid also offers the following buttons:
- Delete: this will delete that element and will remove it from the design.
- Apply to All: this will apply the current properties to all the elements in the header and footer with the same type. For example if you are editing a Label element, clicking on Apply to All button will copy the font style, colors and size to all other labels.
- Display Settings: the lower portion of the property grid covers the global font style, header height, footer height, and display units (mm or inch).
Leading / Trailing Text
For Database Field elements user can enter values for Leading Text, and Trailing Text properties. These texts will appear before and after the element when generating the report.
For example, if an element is linked to show the SPT Hammer Energy on the header of your log and you set the Leading Text = "Er=" and Trailing Text ="%" then the output on the log would look like "Er=65%" where 65 is coming from the SPT Hammer Energy efficiency of that borehole.
Header or Footer Height
These can be adjusted from the Display Settings section of the property grid.
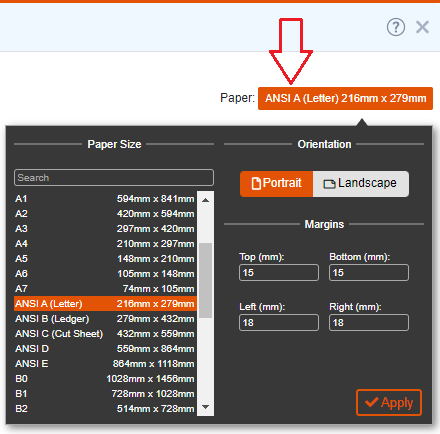
Paper Settings
In order to edit page settings, click on the orange Paper button at the top-right of screen. This allows changing paper size, orientation and page margins.
File Options
The following file options are available on the top toolbar:
- Import: allows for importing the following file types:
- RSLog Header/Footer Design: used for importing files (*.xml) that are generated by RSLog Header/Footer Designer feature.
- Raster Image: allows for importing an image (*.png) to the header area. Once added, you can move and resize the image.
- Export: this feature is used to export your header and footer design to the following formats:
- RSLog Header/Footer Design: exports your design into a file that can be imported to another template.
- Raster Image: exports your design as a raster image (*.png).
- Vector Image: exports your design as a vector image (*.svg).
- Undo / Redo: use these buttons to reverse changes that you made in the design.
View Options
The following view options are available on the top toolbar:
- Show Grids: click this icon to turn the grids on or off. Grids are used for aligning the elements on the header of footer, and will not be shown on the final report. The size of the grids can be selected from the left property grid under the Display Settings > Global Settings section.
- Snap to Grid: this feature is useful when moving or resizing objects. The grid size may be selected from the left property grid under Display Settings > Global Settings section.
- Zoom: use the zoom buttons on the toolbar to adjust the view to desired zoom level (up to 200% of the actual size). The 100% zoom shows the template in actual size. Mouse wheels could also be used for zoom.
Selecting an Element
You can select an element by clicking on it. This will populate the upper portion of the property grid with settings of that element where you can edit the appearance and behavior of the element. Right-click on an element offers the following options:
- Bring to Front: brings the element above all other elements that have overlap with that element.
- Send to Back: moves the element below all other elements that have overlap with that element.
- Duplicate: adds a copy of the element to the header or footer.
- Delete: deletes the element from the header or footer.
Selecting Multiple Elements
In order to arrange multiple elements, select them by one of the following options:
- Click on the first element, then press and hold Ctrl key and select more elements by clicking on them, or
- Use mouse to draw a box on screen. All the elements that are located within that box will be selected.
Once a group of elements are selected, right-click on one of the elements for more options:
Aligning a Group of Elements
Select the Align menu and click on desired submenu to align the elements as you wish.
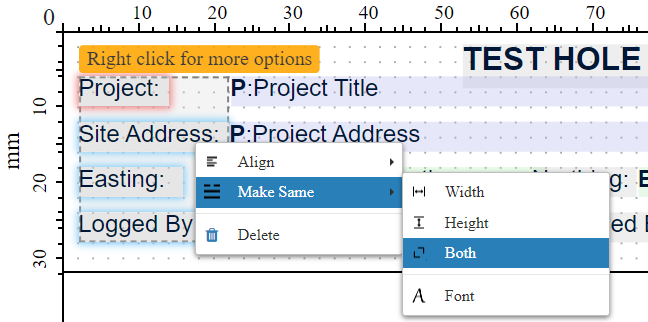
Making a Group of Elements the Same Size
Select the Make Same menu and click on desired submenu to make the elements same size.
Deleting a Group of Elements
Select the Delete menu to delete all selected elements.
Database Field Element
The Database Field elements are used for linking a label to a specific piece of data coming from the project or borehole (e.g. project title or borehole depth). The settings pertaining to a Database Field element become available on the left property grid when it is selected. The Source property determines the source of data:
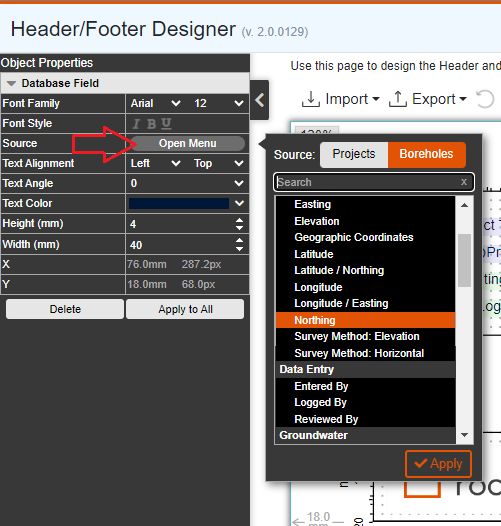
The following provides more details on the Source property:
Source is 'Projects'
When Project is selected as the Source of the Database Field, it will be shown on the template with a light purple background color and the following options become available in the list for the Source property:
- Client Address: prints the client address,
- Client Name: prints the client name,
- Coordinates System: prints the coordinates system used for the project (e.g. "Geographic"),
- Depth Units: prints either "ft" or "m" based on project's unit system,
- Geographic Coordinates: prints the geographic coordinates (i.e. latitude and longitude) of the project (e.g. "39.52156, -123.38151"). Please note that this is the coordinates of the Project Location specified by user,
- Lead Engineer: prints the Lead Engineer,
- Project Address: prints the Project Location entered for the project,
- Project Number: prints the Project Number entered for the project,
- Project Notes: prints the Notes entered for the project,
- Project Title: prints the Title of the project,
- QR Web Link: prints the URL entered for the QR Code on project's page,
- Unit System: prints the name of the unit system used (i.e. "Imperial" or "Metric")
- Location Details: prints specific data entered by user in Additional Settings section of the project data entry page,
- Extra Tags: prints the value of the Extra Tags defined for projects on Settings page.
Source is 'Boreholes'
When Borehole is selected as the Source of the Database Field, it will be shown on the template with a light green background color and the following options become available in the list for the Source property:
- Coordinates Group: select from the list of data entered on the Test Hole edit page → General tab → Coordinates tab,
- Data Entry Group: select from Logged By, Entered By, and Reviewed By entered on the Test Hole edit page → General tab → Coordinates tab,
- Groundwater Group: select which groundwater data to show:
- Water Depth: prints groundwater depth entered on the Test Hole edit page → General tab,
- Water Elevation: prints groundwater elevation calculated based on groundwater depth and borehole collar elevation,
- Piezometer Readings: prints a table with all groundwater level measurements entered on the Instrumentation tab of the borehole data entry page,
- Location Details Group: select from the list of data entered on the Test Hole edit page → General tab → Location Details tab,
- Completion Notes Group: select to show Start Notes or Termination Notes as entered on the Test Hole edit page → General tab → Completion Notes tab,
- Site Investigation Group: select from the list of relevant data entered on the Test Hole edit page → General tab,
- SPT Hammer Group: select from the list of data entered on the Test Hole edit page → General tab → SPT Hammer tab,
- USACE Group: select from the list of data entered on the Test Hole edit page → General tab → USACE tab,
- Test Hole Data Group: select from the main test hole data entered on the Test Hole edit page → General tab. For example: depth, name, plunge, trend,
- Extra Tags Group: prints the value of the Extra Tags defined for boreholes on Settings page.
Image / Logo Element
This element displays an image (e.g. company logo) on the header or footer. The Source property of this element determines where the image comes from:
- Company Logo: this will automatically display the company logo uploaded by user on Company Account → Company page,
- Upload: this allows user to upload an image,
- Featured Photo: Up to 4 test hole featured photos can be added to the header or footer. Please see this page for more details.
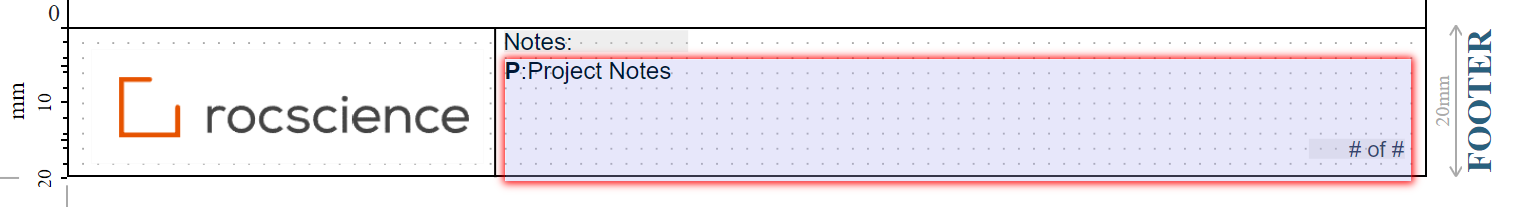
Printable Zone
RSLog generates the reports based on the template design created by user. If an element on the Header & Footer Designer page is located outside the 'printable zone', it will be highlighted in red (see screenshot below). In such cases, the program offers two options: either delete that element or to re-arrange it. If re-arrange option is selected, the element is automatically moved inside the printable zone.