Log Columns
Borehole data in a log is presented in various Log Columns, each designed to display certain type of data. To edit the layout of log columns in a borehole log template:
- Go to Report Templates page.
- Edit the desired borehole log template from the list. This opens a new page.
- Scroll down to the lower potion of the page to see the list of log columns.
List of Log Columns
The lower portion of the page on a log template design page shows the list of log columns that are added to this log template. The first row on this table represents the first log column from the left; The last row on this table represents the rightmost log column on the borehole log template.
Order of Log Columns
 'handle' on the left end of that row and drag it to the desired position.
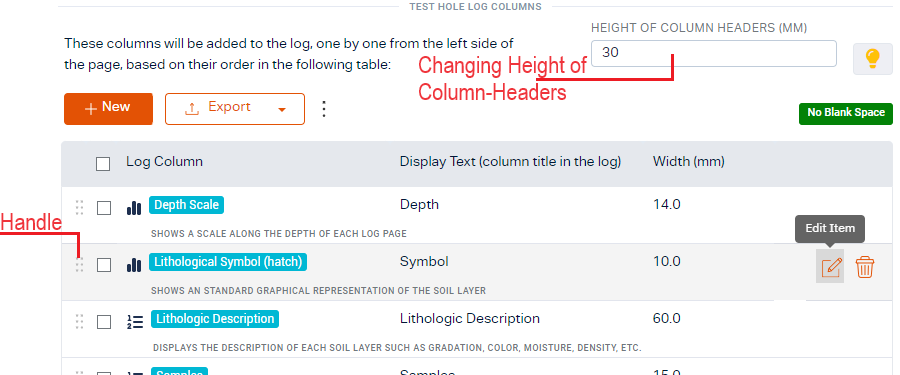
Height of Column-Headers
To set the the height of the column-header row use the textbox on the top-right of the list of log column (see the screenshot above).
Blank Space
As you make changes in the list of log columns the program calculates the 'blank space' on the log. This is calculated based on the page width, left and right margins (see the Customize Layout section), and the total width of all log columns. The 'blank space' is shown at the top-right corner of the table.
Log Column Types
Each log column either displays a Text / Number in the borehole log or presents data in Graphic format.
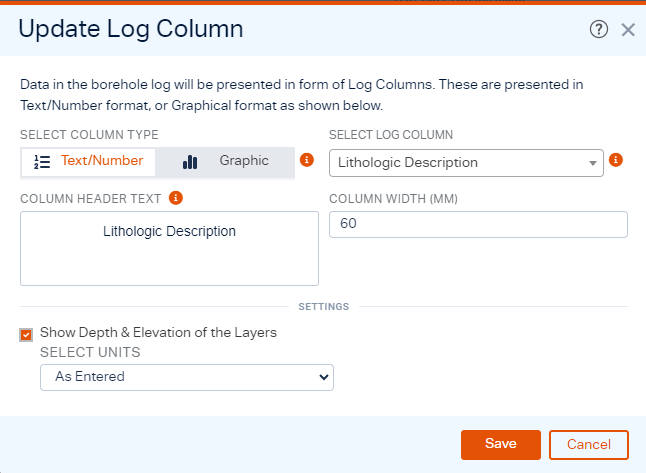
- Column Type: choose between Text/Number and Graphic options,
- Column-Header Text: this is the title of the log column in the borehole log. This accepts multi-line text and you can format it by selecting part of the text and pressing these keys:
- Ctrl+B: to make the selected text bold.
- Ctrl+I: to make the selected text italic.
- Ctrl+U: to make the selected text underlined.
- Column Width: determines the width of the the log column (mm / inch).
- Additional Settings: depending on the log column selected, additional settings may be available (see below for details).
Text/Number Columns
These log columns show either a number (e.g. blow counts, moisture content, etc) or a text (e.g. lithologic description, depth related remarks, etc). The log columns available in this category include:
- Atterberg Limits: displays the results of Atterberg Limits test entered on the Lab Tests page.
- Show PI Instead of PL: by default, the Atterberg Limits column shows Liquid Limit (LL) and Plastic Limit (PL) in the log. By selecting this checkbox, instead of PL, Plasticity Index (PI) will be shown.
- Comment / Additional Notes: displays comments or remarks at specific depths in the borehole log (e.g., drilling notes, seepage, change in the drill method or casing size etc.). The source of this column is the data entered in the Comments tab of test hole edit page.
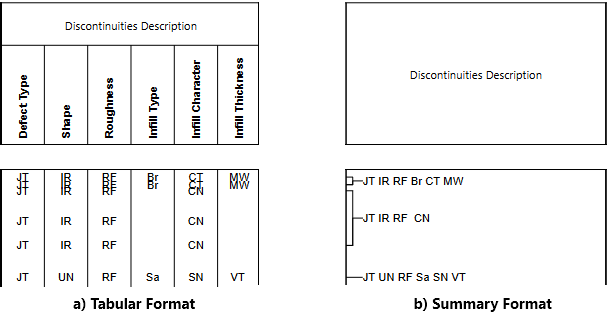
- Discontinuities: displays the discontinuities data in selected format. This is based on the data entered in the Discontinuities tab of the test hole edit page.
- Select Discontinuity Parameters: User can select which sub-columns should be included in log. Please note a minimum 5 mm width is required for each sub-column.
- Display Mode: the discontinuities data can be shown in the following formats:
- Tabular: displays selected parameters as a table in the log column (see Figure a) below).
- Summary: displays a summary of defect properties at each depth. This summary uses the Symbols associated with each defect parameter on Settings page > Rock Classification tab > Defects tab (see Figure b) below).
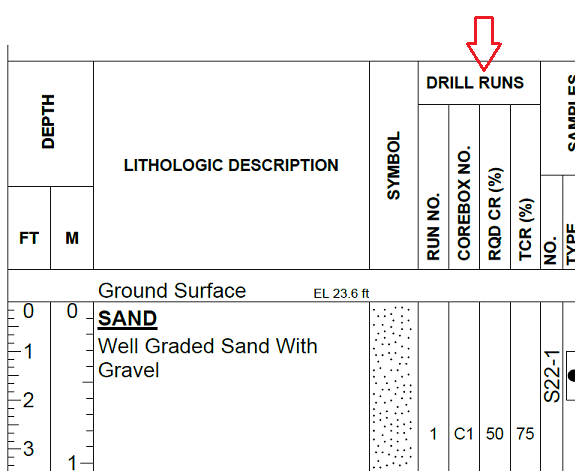
- Drill Run Info: displays the drill run data in a tabular format. This is the data entered in the Drill Runs tab of the test hole edit page.
- Select Sub-Columns: User can select which sub-columns should be included in log. Please note a minimum 5 mm width is required for each sub-column.
- Field Test Results: displays the results of a field test (e.g. SPT, Hydrocarbon, etc) data entered in the Field Tests tab of the borehole data entry page.
- Select Field Test: use the dropdown to select the field test for which the results are presented in the log.
- Select Test Column: each field test may have multiple data columns. User can select the data column that needs to be presented in the log.
- Gradation Test: displays the results of gradation/sieve test entered in Lab Tests page. By default, this log column displays 4 sub-columns: Gravel, Sand, Silt and Clay. To include a 5th column for Fines, please select the checkbox Show Fines Sub-Column.
- Lab. Test Results: displays the results of the selected lab test as entered in Lab Tests page.
- Select Test Category: refers to various categories (i.e. data entry tabs) on the Lab Tests page.
- Select Lab. Test: depending on selected Test Category, select the lab test that should be shown in the borehole log.
- Show Sample 'Guide' Lines: if selected, a line will be drawn in the log column at depths corresponding to the top and bottom of each sample.
- Layer Elevation / Depth Bar: displays a column with the elevation and depth shown at the top and bottom of each layer.
- Lithologic Description: displays the data entered in the Stratigraphy tab of the test hole edit page in a column in the borehole log.
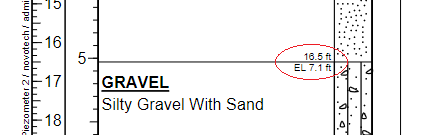
- Show Depth & Elevation of the Layers: if selected, the depth and elevation of bottom of each layer will be shown in the log column (see below). You can also define whether these numbers should be presented As Entered (i.e. in project's unit system), Always in Feet, or Always in Metres.
- Method of Investigation: displays two sub-columns in the log: Method of Investigation (e.g. auger drilling, etc.), and Drill Rig. The source of this column is the data entered in the Boring Details tab of test hole edit page.
- Moisture: displays the results of moisture content test in the log. The source of this test column is the data entered in Lab Tests page > Index Tests tab > Moisture column.
- Organic Matter: displays the results of organic matter test in the log. The source of this test column is the data entered in Lab Tests page > Index Tests tab > Organic Matter column.
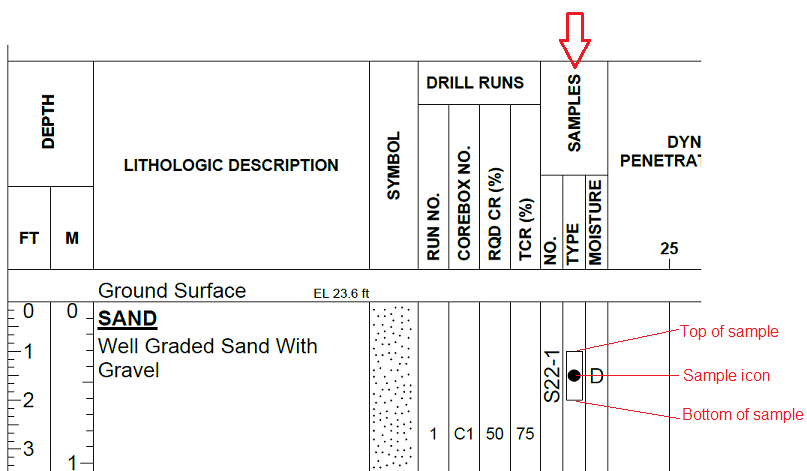
- Samples: displays sample information as a column in the log. The source of this column in the data entered in the Samples tab of test hole edit page.
- Sample Box: draws a box around the sample icon. The top and bottom of this box correspond to the top and bottom of the sample.
- Sample Number: the sample number will be shown as a sub-column.
- Moisture Level: the symbol corresponding to sample moisture level will be shown in a sub-column (e.g. D for Dry, DM for Dry to Moist, etc.). The moisture descriptors could be customized on Settings page > Field Investigations tab > Sampling and Boring tab.
- RQD: shows the RQD (%) of the sample.
- Recovery Length: shows the Sample Recovery Length.
- Recovery (%): shows the Sample Recovery (%).
- Sample Type: the sample type sub-column will be shown next to the sample number. User can select to show the Sample Type in the following formats (refer to the Settings page > Field Investigations tab > Sampling and Boring tab for Symbols and Icons):
- Symbols: shows the symbol for each sample type (e.g. AU, CC, etc),
- Icons: shows the icon associated with each sample type.
- Color: shows the Color of the sample (e.g. brown, bluish gray, etc).
- Location / Status: writes the symbol associated with the location / status of the sample (refer to the Settings page > Field Investigations tab > Sampling and Boring tab).
- Depth Range: shows the sample depth; For example: "1.8 m" or "2.5 to 3.0 ft".
- Sample 'Guide' Lines: if selected, in all lab test log columns a line will be drawn at depths corresponding to the top and bottom of each sample.
- Soil Classification: displays the soil classification entered by user in Lab Tests page > Index Tests tab > Soil Class column.
- Strata Properties: displays a specific information for a stratum (entered on test hole data entry page > Stratigraphy tab) in a separate columns. For example: layer Color, layer thickness, layer hatch code, layer soil classification, layer elevations, layer moisture level and more.
- Summary List of Lab Tests: displays a list of lab. tests carried out on a specific sample. This only includes acronym of lab. tests, not the test results.
Graphic Columns
These log columns show either a graph or some sort of drawing, and are further broken down below:
- Atterberg Limits & Moisture Plot: displays the variation of Atterberg limits tests along the depth of a test hole. The source of this graph is the Liquid Limit and Plastic Limit entered in the Lab Tests page.
- Show Gridlines: if selected, horizontal gridlines will be shown at every 1 ft or 1 m of depth.
- Depth Scale: shows a depth scale in the log. User can select to show metres and/or feet on the depth scale.
- Feet: if selected, the depth scale shows feet only (on the left half of the scale).
- Metres: if selected, the depth scale shows metres only (on the right half of the scale).
- Water Symbol: determines which groundwater level should be shown on the this log column. Please read this article for options available for groundwater data of a borehole.
- Depth Label Interval: determines how often the depth labels are printed along the column.
- Tick-Marks: determines the frequency of minor and major tick-marks along the depth scale.
- Discontinuities: visualizes the alpha angle (deg) with a line at each depth. The angle of this line from horizontal corresponds to the alpha value.
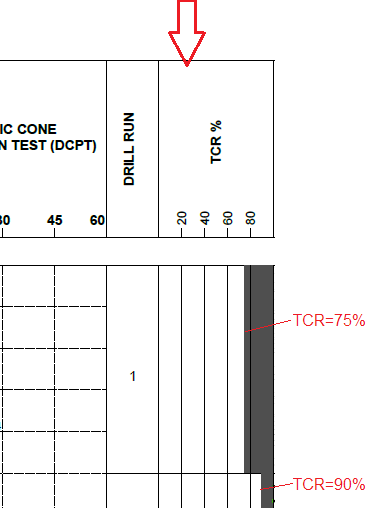
- Drill Run: displays the results of TCR, SCR, TMR, RMR, etc as a stepped graph in the borehole log. The source of this column in the data entered in the Drill Runs tab of test hole edit page.
- Show Run No. Sub-column: adds a sub-column on the left side of the column to show the run number.
- Show Depth Interval Lines: draws a horizontal line at the bottom of each run, separating it from the next run.
- Select Sub-Columns: for each sub-column selected, you can specify the color and direction of the plot:
- → means the horizontal axis increases to the right; and
- ← means the horizontal axis increases to the left.
- → means the horizontal axis increases to the right; and
- Elevation: displays the variation of elevation along the depth of the borehole. The top of Elevation log column on the first page of the borehole log matches with the borehole collar elevation entered in the General tab > Coordinates section.
- Feet: if selected, the depth scale shows feet only (on the left half of the scale).
- Metres: if selected, the depth scale shows metres only (on the right half of the scale).
- Water Symbol: determines which groundwater level should be shown on the this log column. Please read this article for options available for groundwater data of a borehole.
- Depth Label Interval: determines how often the depth labels are printed along the column.
- Tick-Marks: determines the frequency of minor and major tick-marks along the depth scale.
- Lithological Symbol (hatch pattern): displays the hatch pattern (legend) of a stratum. This is based on the hatch patterns selected in Stratigraphy tab of test hole edit page.
- Hatch Options: during defining a stratum, hatch pattern may be selected from the main categories: USCS (Unified Soil Classification System), AASHTO (American Association of State Highway and Transportation Officials), AGS (Association of Geotechnical & Geoenvironmental Specialists - UK), Rock, and Other.
- Color Settings: user can select both foreground and background colors of a hatch pattern on the Settings page > Hatch Designs tab.
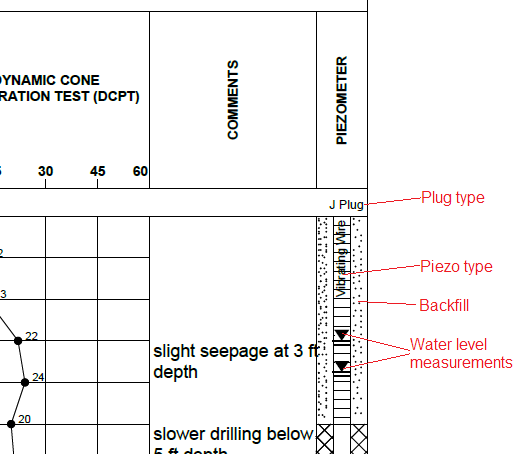
- Piezometer / Well: displays the details of piezometer/well construction for a test hole according to the data entered in the Instrumentation > Piezometer / Well tab of borehole data entry page.
- Include Water Level Measurements: if selected, groundwater level measurements entered in Groundwater Monitoring section of the Piezometer / Well tab will be displayed in the log.
- Nested Piezometers: this log column supports multiple piezometers.
- Field Tests: displays the variation of field tests along the depth as a graph. This is based on the data entered in Field Tests tab of test hole edit page.
- Select Field Test to Show: user can select desired field test from the dropdown list.
- Select Test Column: each field test may have multiple data columns. User can select the data column that needs to be plotted.
- Show Gridlines: if selected, gridlines will be show at every 1ft / 1m of depth.
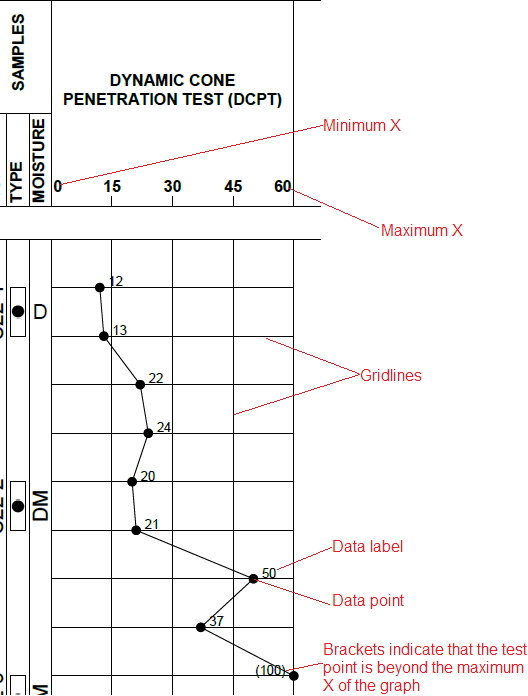
- Draw the Graph Line: if selected the line connecting data points will be drawn in the graph (see below screenshot).
- Draw Data Points: if selected, for each data entry a black circle will be drawn in the graph.
- Draw Data Labels: if selected, for each data entry the value of the field test will be printed in the graph.
- Min. (X Axis Range): determines the minimum value used for the horizontal axis (i.e. field test result) of the graph. If not entered, zero will be used.
- Max. (X Axis Range): determines the maximum value used for the horizontal axis (i.e. field test result) of the graph. If not entered, 100 will be used.
- Divisions (X Axis Range): determines the number of divisions used for the horizontal axis (i.e. field test result) of the graph.
Multiple Parameters On a Graph
In order to show multiple parameters (e.g. SPT blow counts + moisture contents + pocket penetrometer, etc.) on the same graph, please use the Graph (customizable) log column. This log column allows plotting multiple soil parameters on the same graph (e.g. SPT blows, moisture, pocket penetrometer, LL and PL):
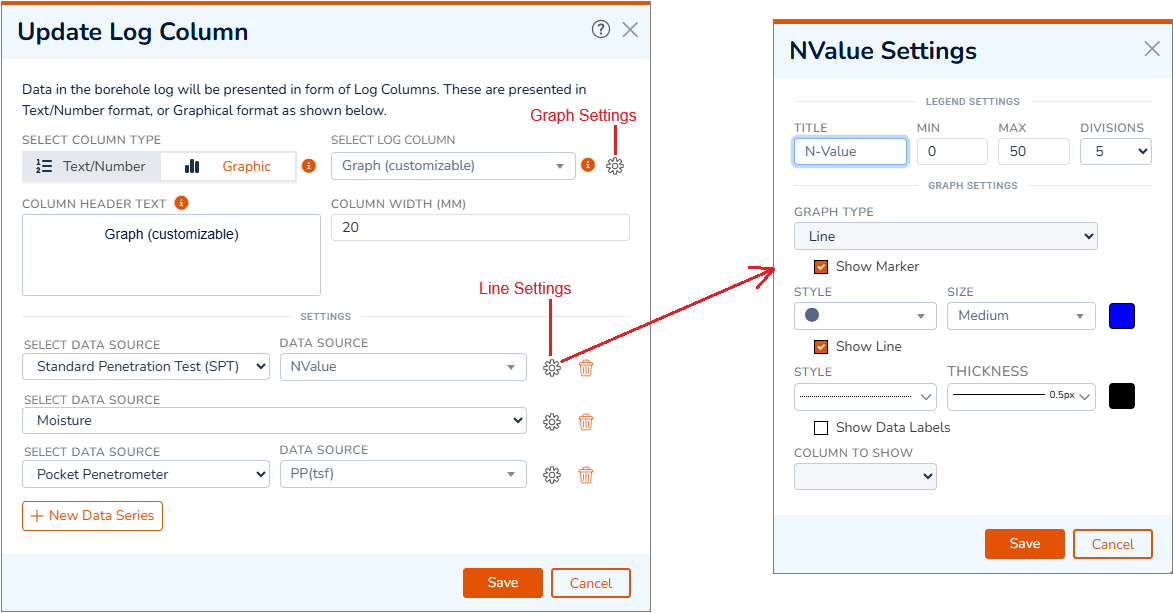
- Graph Settings: Click on the cogwheel icon next to the Select Log Column dropdown to select the gridline settings.
- New Data Series: click on this button to add a new parameter to the graph.
- Select Data Source: select the soil parameter from the list of field tests or lab tests.
- Line Settings: click on the cogwheel button. This will open a new dialog box with the following options:
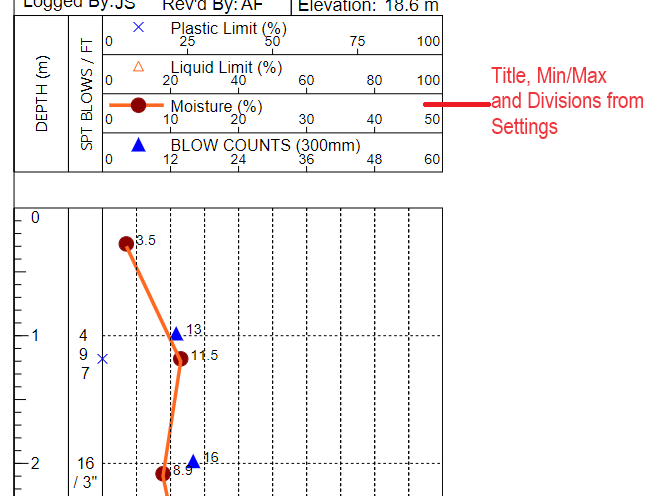
- Legend Settings: enter legend title, minimum, maximum and number of divisions for selected parameter.
- Graph Type: select the type of graph.
- Marker Settings: select the settings of the marker shown at each data point.
- Line Settings: select the settings of the line drawn between the data points.
- Data Labels: if selected, the value associated with each data point will be shown beside its marker.
Showing Groundwater Data
Please read this article for data entry and presentation of groundwater data.