Customization
RSLog is designed with flexibility in mind. We understand that consulting engineers use different data templates and borehole log templates depending on the type of subsurface investigation, type of project, and local practice. The following provides customization options available in RSLog:
Data Entry Customization
The following is a summary of data entry customization. Please note that these customizations are applied to your RSLog account (i.e. all users) and it covers all previous, current and future projects.
Default Settings
These settings determine the default values pre-selected by RSLog on various data entry pages (e.g. default project unit system).
- New Projects: default values when creating a new project (edit this on Settings → Data Entry),
- New Test Holes: default values when creating a new test hole (edit this on Settings → Data Entry),
- Completion Notes: the default text for Start Notes and Termination Notes is generated based on these settings (edit this on Settings → Data Entry),
- Templates: determines the default log template and figure template used for generating reports (edit this on Settings → Global Settings dialog → Templates),
- Page Settings: default page settings when creating a new report template (edit this on Settings → Global Settings dialog → Templates).
Dropdown Lists
Data entry for a test hole uses several dropdown lists that can be customized by user:
- Sample Types: Use this to add/remove items in the sample type dropdown (edit this on Settings → Field Investigation),
- Drilling Methods: Use this to add/remove items in the drilling method dropdown (edit this on Settings → Field Investigation),
- Piezometer/Well Types: The list of piezometer/well types and well plugs can be customized (edit this on Settings → Field Investigation),
- Moisture Descriptors: Use this to add/remove items in the moisture level dropdown (edit this on Settings → Engine → Calibration),
- Consistency: This list contains the consistency descriptors (for fine-grained soils) used on the Stratigraphy tab of the borehole page (edit this on Settings → Engine → Calibration),
- Apparent Density: This list contains the apparent density descriptors (for coarse-grained soils) used on the Stratigraphy tab of the borehole page (edit this on Settings → Engine → Calibration),
- Investigation Status Levels: Projects and test holes can have Status; This allows determining at what stage the project or test hole is (edit this on Settings → Data Entry → Quality Management).
Soil Classification
The Soil Classification tab on Settings page is used for customizing the options for soil characterization. This mainly affects the lithologic descriptions entered on the test hole data entry page, when the Detailed View is selected by user (see more details).
Rock Classification
The Rock Classification tab on Settings page is used to edit the options for various rock properties (see more details).
Hatch Patterns
You can upload your own hatch patterns on Settings page > Hatch Design tab (see more details). In addition, the color of each hatch pattern may be defined by user.
Field Tests
You can customize the data structure (i.e. columns) of an existing field test or add a completely new field test to your RSLog account (edit this on Settings page → Field Investigation tab → Field Tests tab see more details).
SPT Blow Counts
Please refer to the SPT Data on the Log for more details.
Lab. Tests
The User-Defined tab allows you to create additional lab tests that are not covered within the scope of the Index, Strength or Chemical tests.
Extra Tags
You can expand the list of data entered for a project or test hole by adding Extra Tags on Settings page → Data Entry tab → Extra Tags tab. Here are some examples of Extra Tags: Contract Number (for projects), Drilling Fluid (for boreholes), Abandonment Reason (for boreholes), etc.
Once created, you can enter the values of Extra Tags:
- For Project: edit the project and go to Additional Settings tab.
- For Test Hole: edit the test hole and on General tab go to Extra Tags tab (right side of the page).
Lithology Compiler
When stratigraphy data is entered in Detailed View, RSLog puts all pieces of soil / rock description together and compiles into a Layer Description. This is done when user clicks on the Compile button on stratigraphy data entry page.
The pieces of data that participate in the Layer Description text and their formatting / order is defined by 'Layer Description Compiler'.
Report Customization
Template Design
Create your own figure template and borehole log template using RSLog template designer. With regards to the borehole logs, user can design both header & footer as well as decide which log columns should be displayed on the log.
Need a Different Log Column?
RSLog covers several different log columns for your borehole logs. If you are looking for a specific log column and you cannot find it in the list please see below:
» I Want to Show Variation of a Parameter vs Depth
For example: you read pressure or torque from the drill rig. In this case this data would be presented in the borehole log as a dataset comprising of {depth, value}. To achieve this:
- In order to be able to enter data in RSLog, add the subject parameter by creating a new Field Test on Settings page (e.g. name it "Torque Dataset"),
- Once the new field test is added, go to borehole edit page > Field Tests tab, and select the new field test (e.g. "Torque Dataset") from the list and start data entry (or import data from CSV file),
- In your log template you can decide if this dataset should be shown as numbers or displayed as a graph:
- Edit your log template and add a log column of type Text/Number; For this new log column, select Field Test Results from the list of log columns, then in the Field Tests dropdown list select the new field test (e.g. "Torque Dataset") added in Step 1, or
- Edit your log template and add a log column of type Graphic; For this new log column, select Field Tests Graph from the list of log columns, then in the Field Test To Show dropdown list select the new field test (e.g. "Torque Dataset") added in Step 1.
- Click Save button and use this template to generate your borehole log.
Another example includes adding specific notes/comments at certain depths in the borehole log. This could be anything from driller notes to discontinuities description, lab test summary etc. Since the values entered for a field test can be text, you can use the same approach and add a new Field Test as described above.
» I Want to Show Additional Data Associated with a Sample
In this case, you want to show data that is associated with a sample; For example: sample weight, color, RQD, or a lab test that is not covered by RSLog default lab tests. The best way to handle this type of cases, is to add a user-defined lab test in your RSLog account. This is because lab tests are conducted on a soil / rock sample and therefore the test results are shown at the exact depth at which the sample was taken.
Displaying SPT Blow Counts
Please see this article for various options to show SPT blow counts on the borehole log.
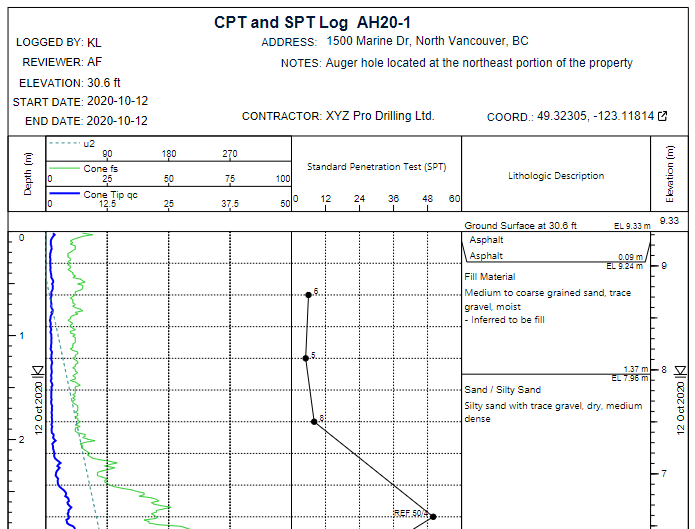
Special Reports
You can create several types of report using a combination of these log columns: Depth Scale, Elevation Scale, and Graph (Customizable). For example, to create a Cone Penetration Test (CPT) report in RSLog:
- Create a new log template (or copy an existing one),
- Setup the page settings and header & footer,
- Add a Depth Scale log column,
- Add a Graph (customizable) log column, and add the following data series:
- select Cone Penetration Test (CPT) field test → select qc
- select Cone Penetration Test (CPT) field test → select fs
- select Cone Penetration Test (CPT) field test → select u2
- Add a Field Test Graph log column to show SPT blow counts,
- select Standard Penetration Test (SPT) field test → select N-Value
- Add a Lithologic Description log column,
- Add an Elevation Scale log column.
This will result in a CPT and SPT report shown below:
GIS System
You can customize the GIS map and import your GIS data (e.g. KML/KMZ, GeoJSON etc).
Other Configuration Options
In addition to the aforementioned customizations, the following configurations are available in RSLog:
User Management
The Admin of your company RSLog account can manage RSLog users.
Access Levels & Permissions
Please use Roles to specify user permissions and access levels.
Project Assignment
You can assign a project to certain users and hide that project from other users.