3D Mode
The 3D Mode is used for viewing the entire project site in 3D along with the terrain model, etc.
To enter 3D Mode:
Getting Started
By default, 3D Mode shows all boreholes and cross sections of the project in a 3D viewer where you can rotate or zoom the model. The following describes the main components of the user interface for 3D page:
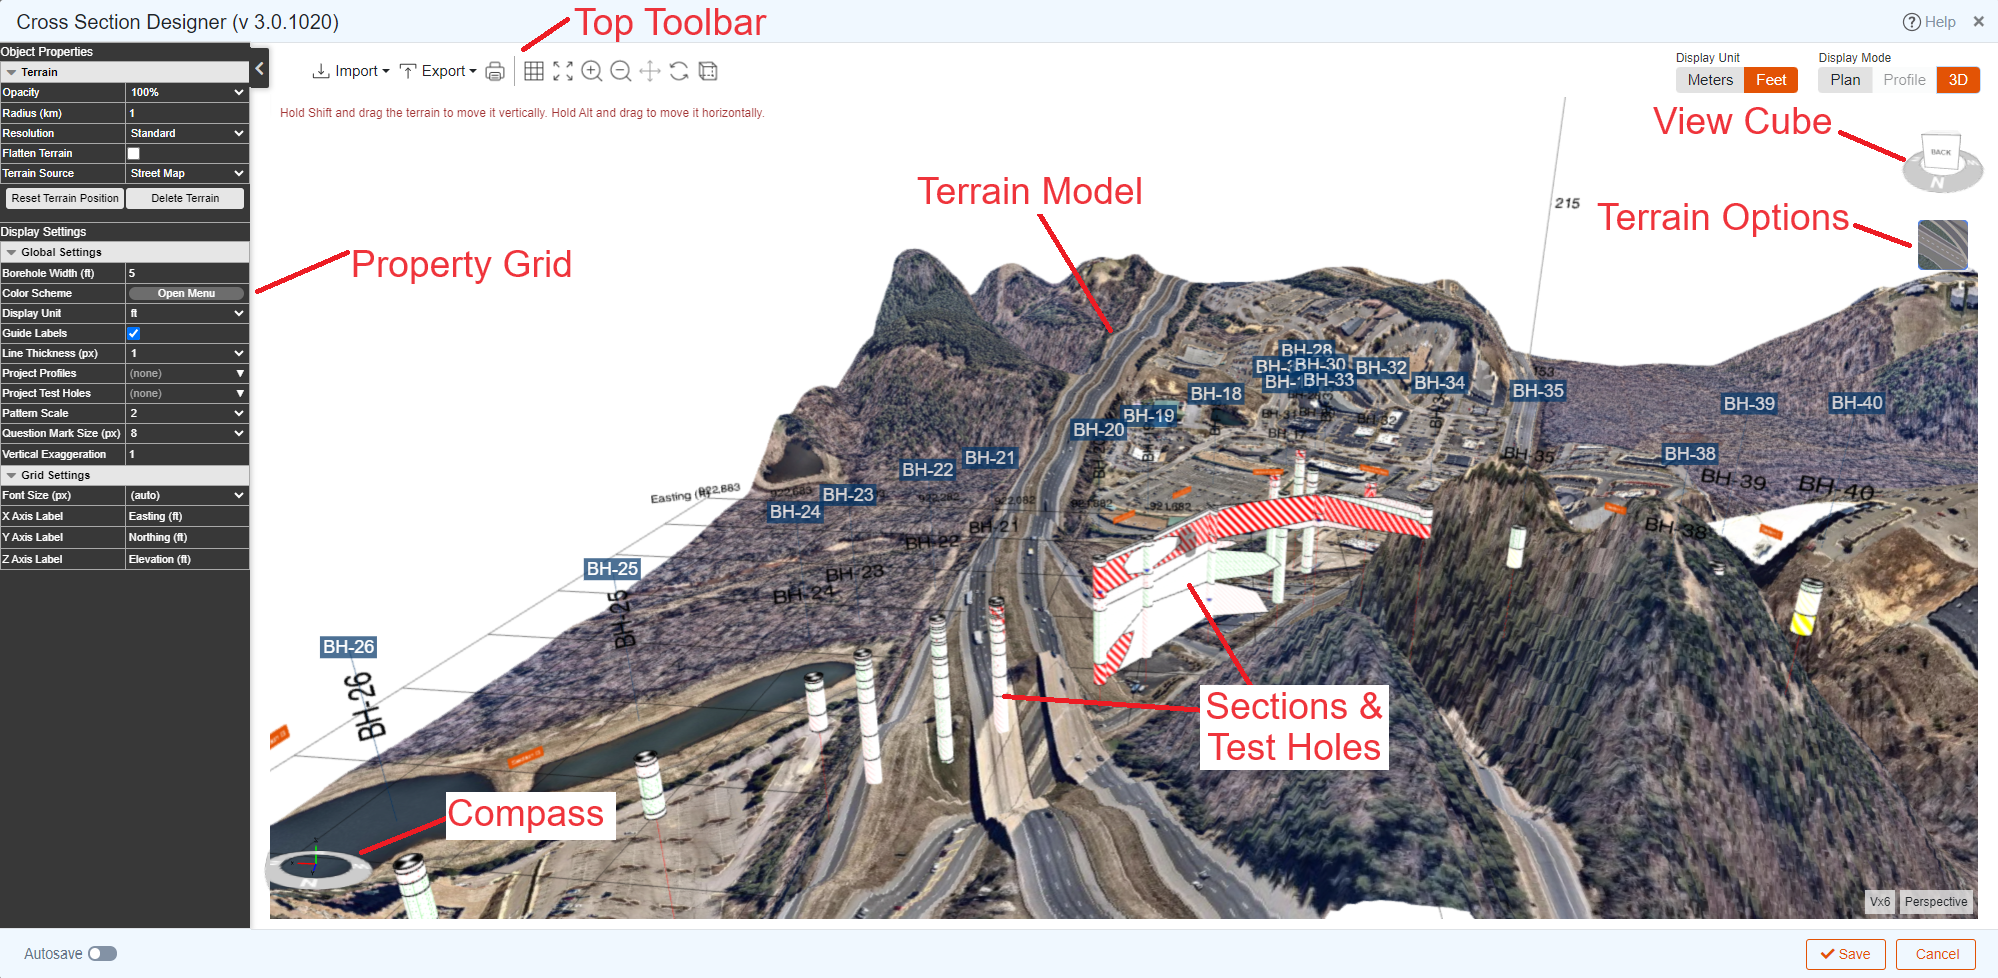
- Property Grid: Each 'object' in has its own properties (e.g. size, transparency etc). To view the properties of an object, click on the object to select it:
- Object Properties: the upper portion of the Property Grid shows the properties of the selected object.
- Global Settings: shows general settings that determine how the boreholes, hatch patterns, and lines will appear on screen.
- Points: determines the appearance of points (vertices) for all polygons. By default, points are shown by red squares. The points may be moved around by grabbing (mouse click & hold) and dropping them at the desired location.
- Section Axis: allows changing the text and font of the horizontal and vertical axes of the viewport.
- Scaling: select different horizontal and vertical scale factors for the cross section.
- 3D Viewer: Shows the boreholes, cross-sections and terrain model. Use mouse or zoom buttons on the toolbar to navigate through the 3D model.
- View Cube: The View Cube is located at the top-right corner of screen where you can switch to top, bottom and side views.
- Terrain Options: click on this button to select the terrain options (see below).
Terrain Model
When the terrain is added to the model, topographic data map tiles are automatically retrieved from the Mapbox server. The terrain data is generated using a wide variety of data sources from government-provided datasets to third-party commercial providers.
Select the Terrain Model to view its properties in the Property Grid:
- Opacity: is used to change the transparency of the terrain layer.
- Radius: determines the size of the terrain model based on the radius (km) from the center of the site. The center of the site is calculated based on all boreholes in the project.
- Resolution: determines the quality of the terrain model. For most projects, Basic or Standard return sufficient details.
- Flatten Terrain: if selected, the terrain model will be turned to a flat view (i.e. no topography).
- Terrain Source: can be selected from the following options:
- Street Map: shows street map with no elevation contours.
- Satellite: shows satellite imagery.
- Solid Contours: simulates the terrain by horizontal slices at 10 m elevation contours.
- Wireframe: similar to Street Map and Satellite but uses wireframe instead of image.
Profile & Test Holes
From the Property Grid under Global Settings section:
- select Project Profiles. This opens a dropdown where you can choose which cross-sections should be visible in 3D viewer.
- select Project Test Holes. This opens a dropdown where you can choose which test holes should be visible in 3D viewer.
Color Options
This property is available on the Property Grid under the Global Settings section. Refer to this article to see what Color Options are available in Cross-Section Designer.
Import Image
You can import any subsurface test results or geophysical outputs to the 3D viewer as an image. In order to import an image, click Import from the top toolbar and select Raster Image (PNG, JPG, etc) from the menu. This opens a new dialog box that allows you to upload and image and select the insertion mode (vertical or horizontal).
Once the image is added to the scene, use its property grid (top-left of screen) to change the opacity, select image type or add notes for this image. To move, scale or rotate the image use the Edit Mode feature on the Property Grid.
Export
Read this page for more details on export options in Cross-Section Designer.