Profile Mode
The Profile Mode is used for designing a cross-section by connecting strata, applying hatch patterns to strata, drawing water table, etc.
To enter Profile Mode:
Getting Started
The first time you switch to Profile page for a new cross-section, the page shows the stick-log of the boreholes in Profile view; The location of boreholes along the cross-section profile is based on their coordinates entered on test hole data entry page. The following describes the main components of the user interface for Profile page:
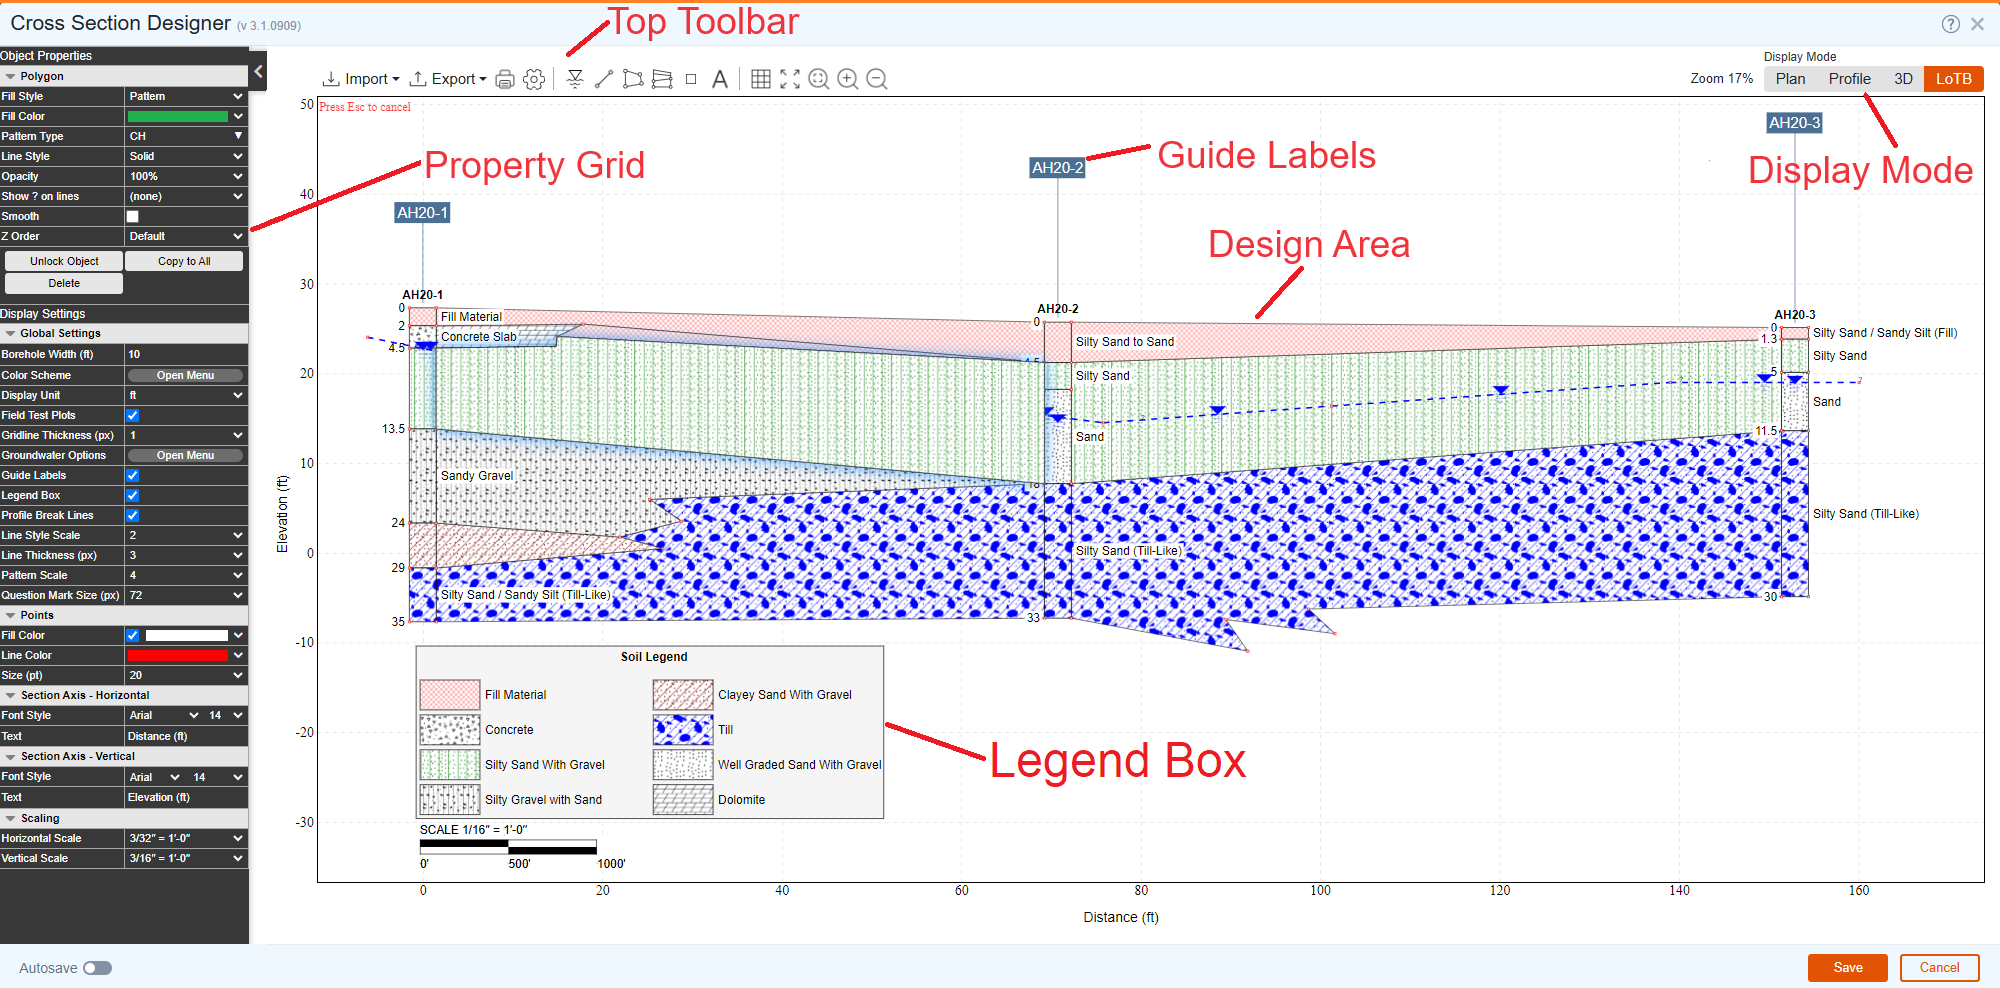
- Property Grid: Each 'object' has its own properties (e.g. text, color, font size, transparency etc). To view the properties of an object, click on the object to select it:
- Object Properties: the upper portion of the Property Grid shows the properties of the selected object.
- Global Settings: shows general settings that determine how the boreholes, hatch patterns, and lines will appear on screen.
- Points: determines the appearance of points (vertices) for all polygons. By default, points are shown by red squares. The points may be moved around by grabbing (mouse click & hold) and dropping them at the desired location. The points representing top and bottom of layers cannot be moved since their location is tied to the borehole stratigraphy data.
- Section Axis: allows changing the text and font of the horizontal and vertical axes of the viewport.
- Scaling: select different horizontal and vertical scale factors for the cross section.
- Design Area: Shows the boreholes and the polygons. A polygon could be drawn using the Draw Soil / Rock Layer button on the top toolbar. A polygon may be connected to a borehole or could be completely independent of a borehole (e.g. to show a buried utility).
- Legend Box: A legend box comprises all soil and rock types used in drawing the cross section. The hatch patterns of all soil and rock types will be presented in individual boxes along with a generic description of that type. A legend box can display data in multi-column format.
Design Area
The Design Area shows all project boreholes and their stratigraphy. If a borehole has field test data (e.g. SPT or Vane shear test) the field test will be plotted beside the borehole.
- The horizontal and vertical axis of the Design Area show Distance (along the soil profile) and Elevation of boreholes, respectively.
- Click on a borehole, polygon or line to select it. The upper portion of the Property Grid shows the properties of the selected object.
- Use mouse to zoom and move the model in Design Area.
- Double-click on an object to zoom to that object.
Borehole Locations
The first borehole is placed at Distance = 0 and the Distance of other boreholes along the profile is measured relative to the first borehole. Therefore, the Design Area shows an 'unfolded' view of the cross-section. The 'break lines' show the location of any break along the cross-section polyline.
Drawing Scales
User can select different horizontal and vertical scales for the profile using the Scaling section at the lower portion of the Property Grid. This is especially helpful when dealing with a linear project where the borehole depths are significantly smaller than the plan extent of the project.
Points
Points are used to shape polygons and polylines, and by default they are shown as red squared in Cross Section Designer. General properties of points may be set from the Points section of the property grid. Points are automatically generated when you draw a line or polygon, however, a new point may be added to an existing line or polygon (see how).
- Fixed Points: These points are added to the top and bottom of each layer on a borehole. These points cannot be deleted or moved because they are linked to stratigraphy data entered for a test hole.
- User-Defined Points: These points are added during drawing a polygon or line by clicking anywhere on screen. In the screenshot shown below, several points are added to the top of Fill Material layer to represent the ground surface topography adjacent to AH20-1
Moving a Point
To move a user-defined point, click on the point and drag it with mouse.
Deleting a Point
To delete a user-defined point, select the point, then from the Property Grid click Delete button.
Adding a Point to an Existing Line / Polygon
To add a point to an existing line or polygon:
- From the top toolbar click on Add New Point button.
- Hover on desired spot on a line segment. The subject line segment will be highlighted.
- Click where you want to add the point.
Merging Points
Points may be merged by dragging a point and dropping it on another point.
Ground Surface Options
Ground surface line is formed by changing the geometry of the topmost stratum on the cross-section (see red layer in the example below). This can be done by using the following methods:
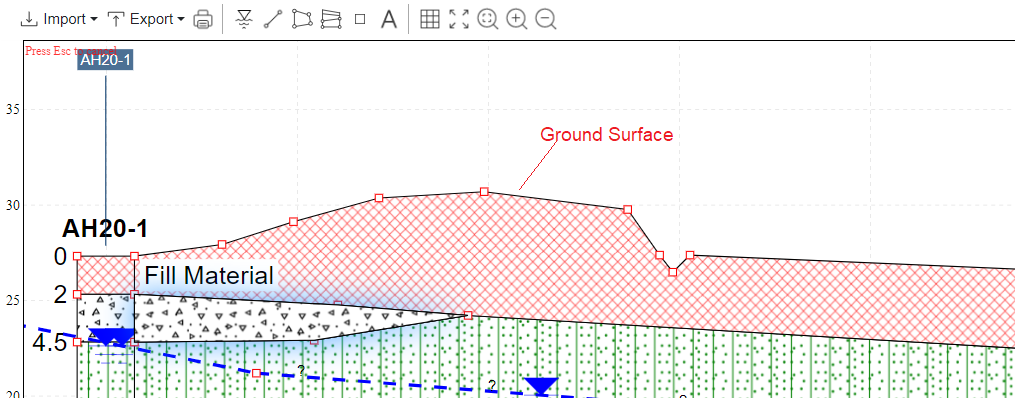
Adding Points
During drawing the polygon for the topmost stratum add as many points as required to form the ground surface and follow the topography in between the boreholes. If the top layer is already drawn, use the top toolbar to insert a Point along the ground surface, then drag it up/down to the desired location.
Import Topography from CSV File
Click Import from the top toolbar and select Polyline by Points (CSV) menu. This requires a CSV file with the following two columns (no column-header row):
- Distance: the first column of the CSV should carry the distance from the beginning of your cross-section (should match with the distance shown on the horizontal axis in your Profile view).
- Elevation: the second column should contains the elevation of points.
Using Estimated Ground Profile
In this case, the estimated ground surface profile along the cross-section will be queried from different map servers (uses LiDAR data with varying accuracy). In order to obtain the approximate ground surface profile:
- Click on Import from the top toolbar.
- Select Ground Surface Profile from the menu.
- This will add an orange polyline to the Design Area. Depending on the elevations obtained for the ground surface, this polyline may be inserted above or below the top of your boreholes. Select the ground surface polyline by clicking on it, and move it around as needed.
Showing Field / Lab. Tests
Each test hole may have data for multiple field tests or lab tests. These test results may be presented on the left or right side of each test hole in Profile Mode, either as a Graph or as a Table. In order to determine which test results should be shown:
- Click on a borehole to select it. This will refresh the upper portion of the Property Grid with properties of the borehole.
- At the top of the list find the Test Data property.
- Click to open the dropdown, and select the desired tests from the list.
Styling and Appearance
By default, the test data is shown as a Graph. To edit the style and properties of a test (e.g. colors, fonts etc.) click on the graph and edit its properties on the property grid.
If you selected to show only one test for a test hole, the graph or table may be dragged around by grabbing it with mouse and moving them to either side of the borehole. If two tests are selected, the Anchor property is automatically set for the Graph or Table and they cannot be moved.
Source Column
Each graph only presents data for one parameter. Use the Data Column property to choose the data source.
Drawing a Stratum
Soil or rock layers are modelled by drawing a polygon and applying a specific color or hatch pattern to that polygon. There are two option for drawing a stratum:
Draw a Polygon
This option is more flexible than connecting multiple layer by clicking. In order to draw a polygon:
- Click on the Draw Soil/Rock Layer from the top toolbar to start drawing a polygon.
- Click anywhere on screen to add the first point of the polygon.
- Polygons are drawn by connecting points (red squares) together. Click anywhere to add a new point.
- Add more points as needed.
- Double click on the last point (or press Enter) to close the polygon.
Connect Layers by Clicking on Them
This option is faster than drawing a polygon, however there is less flexibility with the shape of the polygons created:
- Click on the Create New Strata By Connecting Layers button from the top toolbar.
- Click on the first layer on the first borehole,
- Click on the next layer in the next borehole. Repeat this step as needed.
- When you select a layer in a borehole note the preview of the strata is shown with a dashed red polygon.
- Press Enter after adding the last layer.
Once the polygon is created, you can add more points to straight lines to adjust the geometry.
Import a Polygon from CSV File
Click Import from the top toolbar and select Polygon by Points (CSV) menu. This requires a CSV file with the following two columns (no column-header row):
- Distance: the first column of the CSV should carry the distance from the beginning of your cross-section (should match with the distance shown on the horizontal axis in your Profile view).
- Elevation: the second column should contains the elevation of points.
Adding a Point
In order to add a point to an existing line or polygon:
- Click on the Add New Point button from the top toolbar.
- Hover on the line segment and location that you could like to add a point; The line segment will be highlighted.
- Click to add the point.
Groundwater Options
To show groundwater levels on all boreholes of the cross-section, use the Groundwater Options menu under Profile View Settings section of the property grid:
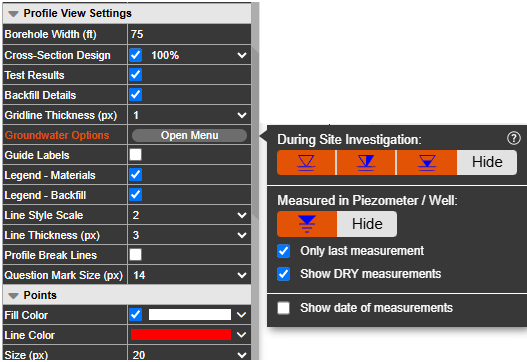
Groundwater Level Observed During Site Investigation
Use these options to show groundwater levels entered on test hole data entry page (General tab). These groundwater symbols can be customized on Settings page → Engine tab → Logs tab.
If you do not wish to show these groundwater levels in your cross-section, from the Groundwater Options property, click Open menu button and select Hide (see the screenshot above).
Groundwater Levels Measured in Piezometer / Well
If your test holes have piezometer / well (i.e. the Instrumentation tab on the test hole data entry page), you can show the schematic design of wells on the left side of your test holes on Profile view. To do so, use the Measured In Piezometer / Well section:
- Only Last Groundwater: if selected, only the last groundwater measurement in piezometer / well will be show for each test hole. This is specifically useful if you made multiple groundwater measurements in this borehole and the last measurement is considered the stabilized water level.
- Show DRY Measurements: if selected, piezometer / well measurements indicated as DRY will also be shown on the borehole.
- Show Date of Measurements: select this option to show the water level measurement date beside each groundwater symbols.
If you do not wish to show the piezometers / wells beside the boreholes, select the Hide option.
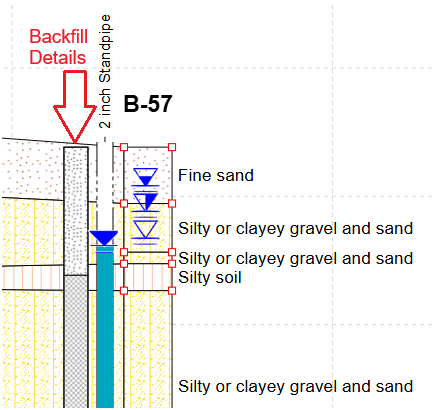
Backfill Details
Use the Backfill Details property under the Profile View Settings section of the Property Grid. The Backfill Details is drawn based on the data entered on test hole data entry page → Drilling Details tab → Backfill button.
Drawing Groundwater Line
To draw a groundwater line, click on Draw Groundwater Line button on the top toolbar. Start drawing a polyline from anywhere on screen and add points as required. Double click on the last point (or press Enter) to complete the groundwater line. Once completed, the property grid will be refreshed with properties of this groundwater line and you can choose color, line style, etc. as desired.
Color Options
Refer to this article to learn more about Color Options available in Cross-Section Designer.
Polygon's Fill Style
The polygons are filled with a solid color or a hatch pattern to represent the material associated with that polygon:
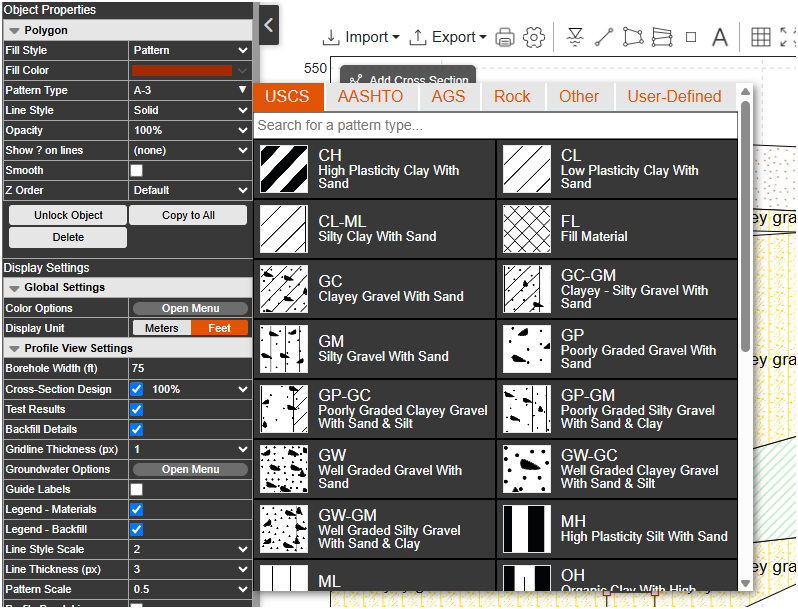
- Click on the polygon to select it. This will show the properties of the polygon in the upper portion of the Property Grid (see screenshot above).
- Select Fill Style property from the following options:
- Void: no fill or hatch pattern is applied to the polygon.
- Solid: the polygon is filled with a solid color selected by Fill Color property.
- Pattern: the polygon is filled with one of RSLog soil or rock hatch patterns.
- Pattern Type: selected from the following categories:
- USCS: soil patterns commonly used for Unified Soil Classification System (e.g. CL, SW, GP-GM, etc.)
- AASHTO: soil patterns commonly used for AASHTO Classification System (e.g. A-1, A-4, etc.)
- AGS: covers all AGS hatch types (e.g. 203, 710, etc.)
- Rock: includes various rock patterns (e.g. Shale, Granite, etc.)
- Other: includes a number of miscellaneous hatch patterns (e.g. Asphalt, Bentonite, etc.)
- User Defined: includes hatch patterns uploaded by user on the Settings page → Hatch Design tab → User-Defined tab of RSLog.
The scale of the hatch patterns is defined by the Pattern Scale property under the Global Settings section of the Property Grid.
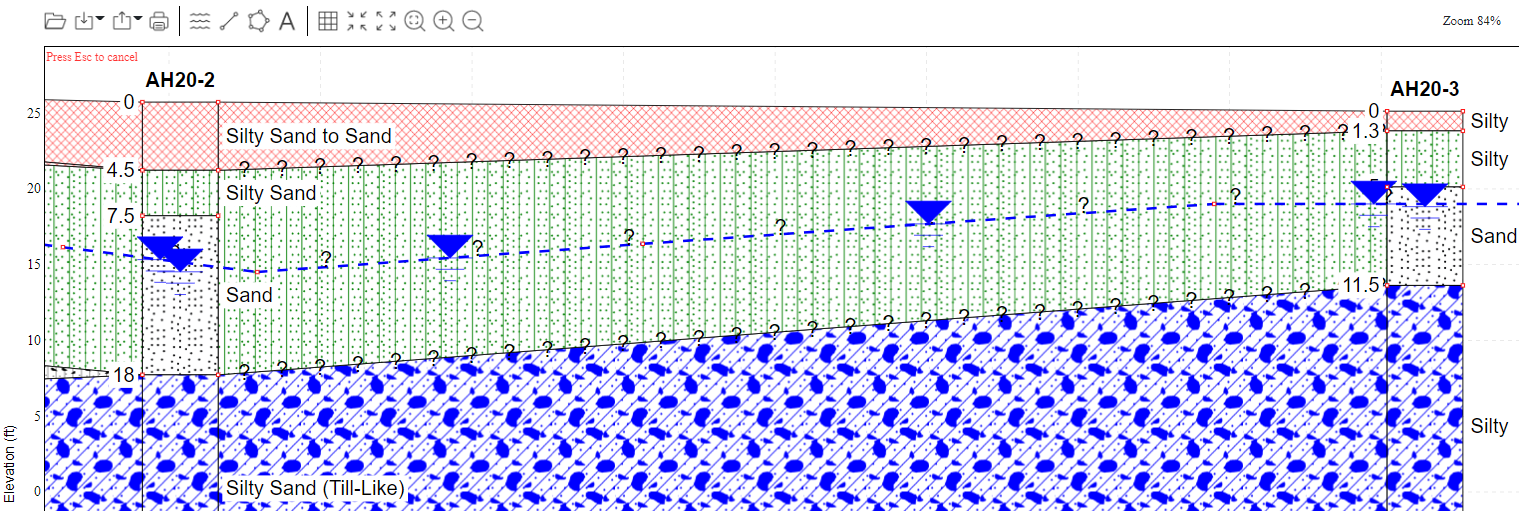
Adding ? to Polygons and Lines
To indicate an uncertain boundary for a layer or groundwater line, use the Show ? on Lines property and select the frequency of ? symbols. The size of ? symbols is selected under Global Settings section of the Property Grid.
Legends
Materials Legend
A complete list of all material types used in the current cross-section is shown in Material Legend. This can be toggled on/off from the Legend - Materials property under the Profile View Settings section of the Property Grid. The legend box may be repositioned and once selected, you can set various properties including:
- General properties such as background color, border, font style, title etc.
- Image size which refers to the individual hatch patterns shown on the legend.
- Number of columns determines how the hatch patterns should be presented.
- Pinned property determines if the legend box should be pinned to a corner of the screen.
Backfill Legend
List of various backfill materials is shown in the Backfill Legend box and it could be toggled on/off from the Legend - Materials property under the Profile View Settings section of the Property Grid.
Other Modes
Use the Display Mode toggle bar at the top-right corner of screen to switch to Plan Mode or 3D Mode or LoTB Mode.
Showing SPT Blow Counts
Any field or lab. test result may be shown beside boreholes on the Profile mode. To do so, select a borehole and use its Test Results property to select the desired field or lab. test(s). You can display up to 2 tests for each borehole (one on the left, and one on the right side of the borehole). When a test is selected, its dataset is shown as a graph on the left side of the borehole.
For example, in order to show SPT blow counts as a table:
- Select the SPT graph by clicking on it. This will populate the left property grid with the properties of the subject SPT graph,
- Edit the Display Options property of the graph, and select Table under Presentation Style. This will show the SPT data in a table,
- Select if you would like to add the Depth and/or Elevation columns to this table,
- Click on "Copy to All" button below the graph property grid to apply the same style to all other boreholes of this cross-section,
- From the Export menu (top toolbar) select AutoCAD DXF. This will export the model as a DXF file.
Once your model is exported to DXF, you will be able to place it in your company title block, edit fonts, and move things around to match your company drawings.
Import / Export
Refer to this article for read about the import and export features in Cross-Section Designer.