Groundwater Data
RSLog covers the following groundwater data for a test hole:
- Observation During/After Drilling: in order to enter groundwater observed during drilling, edit test hole and on the General tab click the link Groundwater Observed During Drilling. This will open a dialog where you can enter the following groundwater levels under the "Groundwater Level to Show in the Test Hole Log" section:
- During Drilling: represents the groundwater depth measured during the drilling. This will use the default symbol
 on the borehole log.
 - Short Term After: represents the groundwater depth measured shortly after the drilling (depending on how 'short term' is defined by the engineer). This will use the default symbol
 on the borehole log.
 - Long Term After: represents the groundwater depth measured after the drilling (depending on how 'long term' is defined by the engineer). This will use the default symbol
 on the borehole log.
- During Drilling: represents the groundwater depth measured during the drilling. This will use the default symbol
- Measurements in a Piezometer/Well: if a piezometer / well is installed in the test hole, groundwater monitoring data is entered on the Instrumentation tab during test hole data entry.
Need a Different Type of Groundwater?
If you would like to add a different type of groundwater measurement, create an Extra Tags for your boreholes. The data entry for the Extra Tags is done by editing the borehole and opening Extra Tags section on the right side of the page.
Groundwater Symbols
To change the symbol used for each groundwater, go to the Settings page → Engine tab → Logs tab. The select groundwater symbols will be used in cross-section designer, and on the borehole logs.
Showing Seepage on the Log
In order to indicate seepage on the borehole log:
- Consider one of the Short-term or Long-term groundwater data entries for seepage,
- As described above, on Settings page → Engine tab → Logs tab assign the seepage symbol
 to the subject type of groundwater,
 - During borehole data entry, enter the depth at which seepage was encountered during drilling for the subject groundwater type (Short-term or Long-term) and save,
- Generate the borehole log and note the seepage symbol shown at the right depth on the log.
Depth vs Elevation
RSLog calculates groundwater elevation based on the groundwater depth and borehole collar elevation. If collar elevation is not available, groundwater elevation won't be calculated/displayed.
Groundwater in Borehole Logs
Groundwater data can be presented on the borehole logs in various ways:
On the Header / Footer
- As a Number: to show groundwater depth or elevation, add a Database Field element to the header or footer of your log template. Link the Source property of this element to any Water Depth or Water Elevation under the Groundwater section. If data is not available for this element, the default text (see section Null Groundwater Data on this page) will be shown on the borehole log.
- As an 'Extra Tag': to show an Extra Tag groundwater depth or elevation, add a Database Field element to the header or footer of your log template. Link the Source property of this element to your desired Extra Tag under the Extra Tags section.
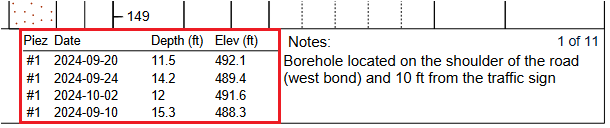
- As a Table: to show the list of groundwater levels measured in the piezometer/well as a table (see example below), add a Database Field element to the header or footer of your log template. Link the Source property of this element to Piezometer/well Readings under the Groundwater section.
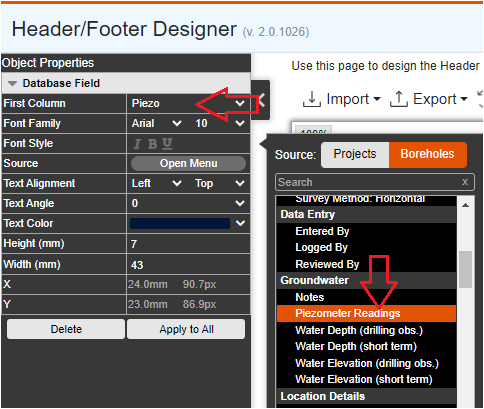
To change the title of the first column in groundwater table, use the First Column property on the left property panel.
As a Piezometer/Well Log Column
To display the details of piezometer / well installation, screen details, groundwater measurements, and backfill details on the log add a new log column Graphic → Piezometer / Well to your log template.
Other Log Columns
Groundwater can be shown on the following log columns: Depth Scale, Samples, Lithologic Symbol (hatch), Elevation, and Piezometer/Well. The following options are available:
- Observation During Drilling: the groundwater symbols used on the log columns depend on the type of water level (see top of this page for details).
- Last Piezometer Measurement: this option will show the last groundwater measurement on this log column using the
 symbol. User has the option to show the date of the measurement.
 - All Piezometer Measurements: this option will show all groundwater measurements on this log column using the symbol. User has the option to show the date of each measurement.
Null Groundwater Data
You can choose how the borehole log should report groundwater data in the cases where groundwater was not encountered or it was not measured. To do this, navigate to the Settings page → Engine tab → Logs tab. Review the borehole log options when groundwater data is unavailable or not present in the hole.
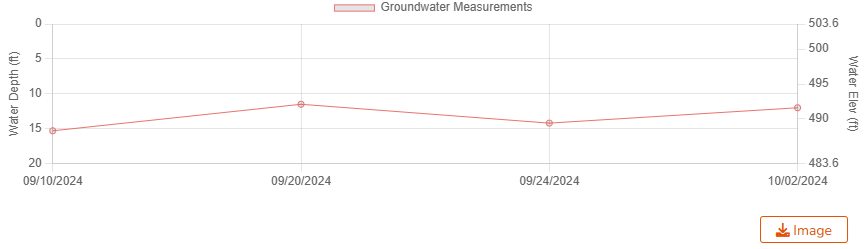
Plotting Groundwater Data vs Time
Groundwater measurement made inside a piezometer / well are recorded in RSLog along with a date and time for each measurement on borehole data entry page → Instrumentation tab → Groundwater Measurements section. Once this data is entered, the variation of groundwater depth / elevation versus time will be plotted on this page. This graph may be downloaded as an image (PNG).
Showing Groundwater on Cross-Sections
Please see this page for displaying groundwater data on cross-sections.