Plan Mode
In Plan Mode the boreholes are shown on the map and user can create or edit cross-sections on plan. In addition, you can import external GIS layers in to the map. Once a cross-section created in Plan Mode, user can switch to the Profile Mode (to design the subsurface profile) or view the project data in 3D Mode.
To enter Cross-Section Designer in Plan Mode:
- Open the Cross-Section Designer page, then select Plan option at the top-right corner of the page.
Getting Started
When Cross-Section Designer loads the Plan Mode, you see a map zoomed to your project location with all test holes shown on the map. This is where you can create or edit cross-sections.
On plan, a cross-section line comprises minimum two points. Each point could be a borehole or an arbitrary point anywhere on the map. In the screenshot below, a cross-section named "Section C" is selected on the map (note the cross-section name is highlighted on the legend). This cross-section starts from BH-08, goes to BH-10 and then goes to a point near BH-12. Between the 2nd and 3rd points, test holes SL-03, BH-09 and BH-12 are projected on the cross-section line (note dash lines perpendicular to the cross-section line). This projection is automatically done when you edit the geometry of the cross-section on the map.
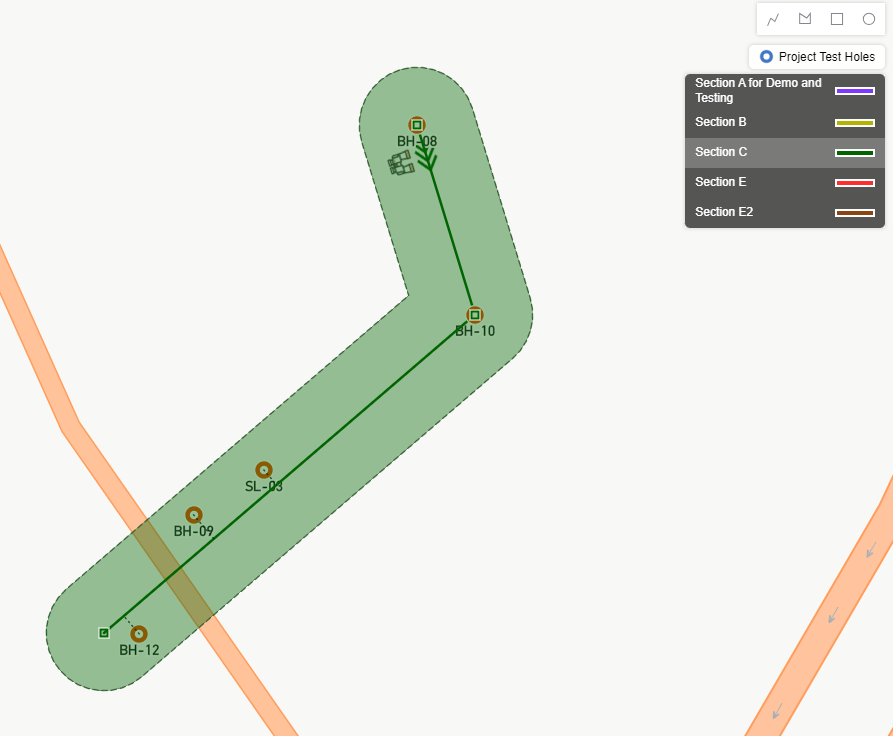
In this case, the area alongside the cross-section line is shaded in green. This shaded area represents the Buffer Distance (see below) which can be adjusted by mouse.
Map Features
Plan Mode comprises a map where you view the test hole locations and edit cross-sections. The map features on available from the buttons located on the bottom-left portion of the map:
- Navigation Features: comprises the following buttons:
- Home: use to zoom the map to the extent of the test holes.
- Zoom: use to zoom in/out.
- Pitch: use to tilt the view. Click on the pitch button to reset.
- Compass: use to rotate the map. Click on compass button to set the map to the North.
- Style: select the map style from: Road, Satellite, Hybrid, Night, and Terra.
- Drawing Basic Shapes: Using the toolbar at the top-right portion of the map you can add basic shapes to the map. These shapes could represent buildings, utilities, etc.
- Adding Cross-Section & Point: To add a cross-section or to add a point to an existing cross-section use the buttons on the top-left portion of the map.
Creating a Section
To create a cross-section click on Add Cross Section button on the top-left portion of the map. Then:
- On the map click to select a test hole or click anywhere to determine the start of the cross-section,
- Add more points as you wish,
- Double-click on the last point or press Enter to complete this cross-section. Press Esc to cancel.
- The program zooms the map to the new cross-section once it is created.
Buffer Distance
The Buffer Distance is the zone along the cross-section where test holes are automatically included in the cross-section. For example in the screenshot above, test holes SL-03, BH-09 and BH-12 are located within the Buffer Distance and are automatically included in the cross-section.
When a test hole is included in the cross-section it will be projected on the cross-section line (see dash lines) and will be shown on the Profile Mode of that cross-section.
Add/Remove a Test Hole
If you want to manually include or exclude a test hole from a cross-section:
- Click on the subject cross-section to 'select' it,
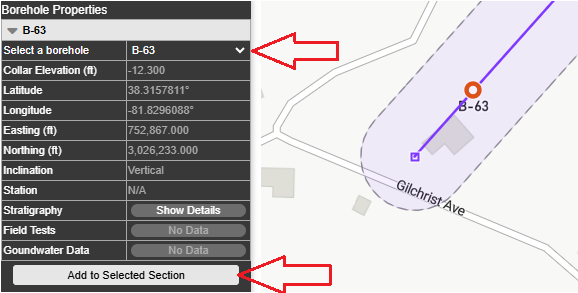
- From the left property grid, under Borehole Properties section:
- Select the desired test hole from the list of boreholes (see screenshot below),
- To include this test hole in the selected cross-section:
- click Add To Selected Section button.
- This will project this test hole to the centerline of the cross-section and add it to the Profile view of the section.
- To exclude this test hole from the selected cross-section:
- click Remove From Selected Section button.
- This will remove this test hole from the cross-section.
Direction of Cross-Section
The starting point of a cross-section (where Distance = 0 in Profile Mode) is specified on plan view by >>>. In the screenshot below, the start of the cross-section is at BH-01. To change the direction of the cross-section (i.e. to change the starting point to BH-03) click on the >>> on cross-section.
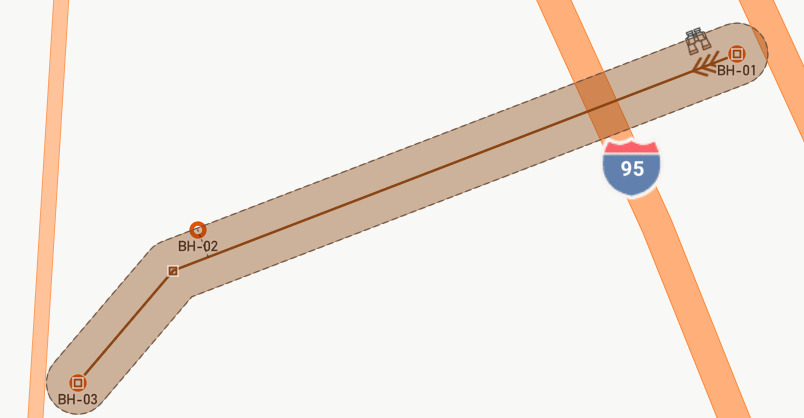
Please note that the Profile Mode always shows the starting point of the cross-section on the left side of screen (i.e. Distance axis increases to the right). The binocular image on the cross-section (see screenshot above) indicates the direction of view in Profile Mode.
Lock/Unlock a Section
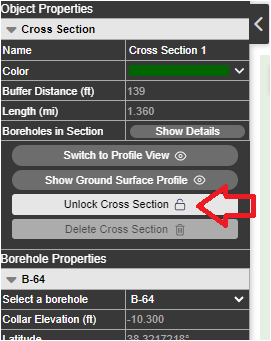
To avoid accidental change/edit of a cross-section you can lock the cross-section. When the Cross-Section Designer is loaded, all cross-sections are locked by default. To make changes to a cross-section you will need to unlock it. To do that:
- Select a cross-section by clicking it,
- From the upper portion of the left property panel, click Unlock Cross Section button,
- You can now edit the cross-section points, add/remove boreholes or delete it.
Section Properties
The list of cross-sections is shown at the top-right of the map area. Click on a cross-section on the legend to select that cross-section. This zooms the map to selected cross-section and the upper portion of the Property Grid loads the properties of the cross-section:
- Cross Section Name: click on this cell to edit the name of the cross-section.
- Color: select the color assigned to the cross-section. The color property is used to differentiate cross-sections on the map.
- Buffer Distance: shows the buffer distance on either side of the cross-section center line. This property is read-only and can be changed by visually adjusting it on the map.
- Length: shows the total length of this cross-section.
- Boreholes in Section: click to view a list of all boreholes included in this cross-section. Changing the Buffer Distance may change the list of boreholes included in a cross-section.
Section Path
To change the path of the cross-section polyline on the map:
- Move a Point: to move a point, drag it with mouse and move it to the desired location.
- Delete a Point: to remove a point from a cross-section, click on that point. Then from the Property Grid click on Delete Profile Point button.
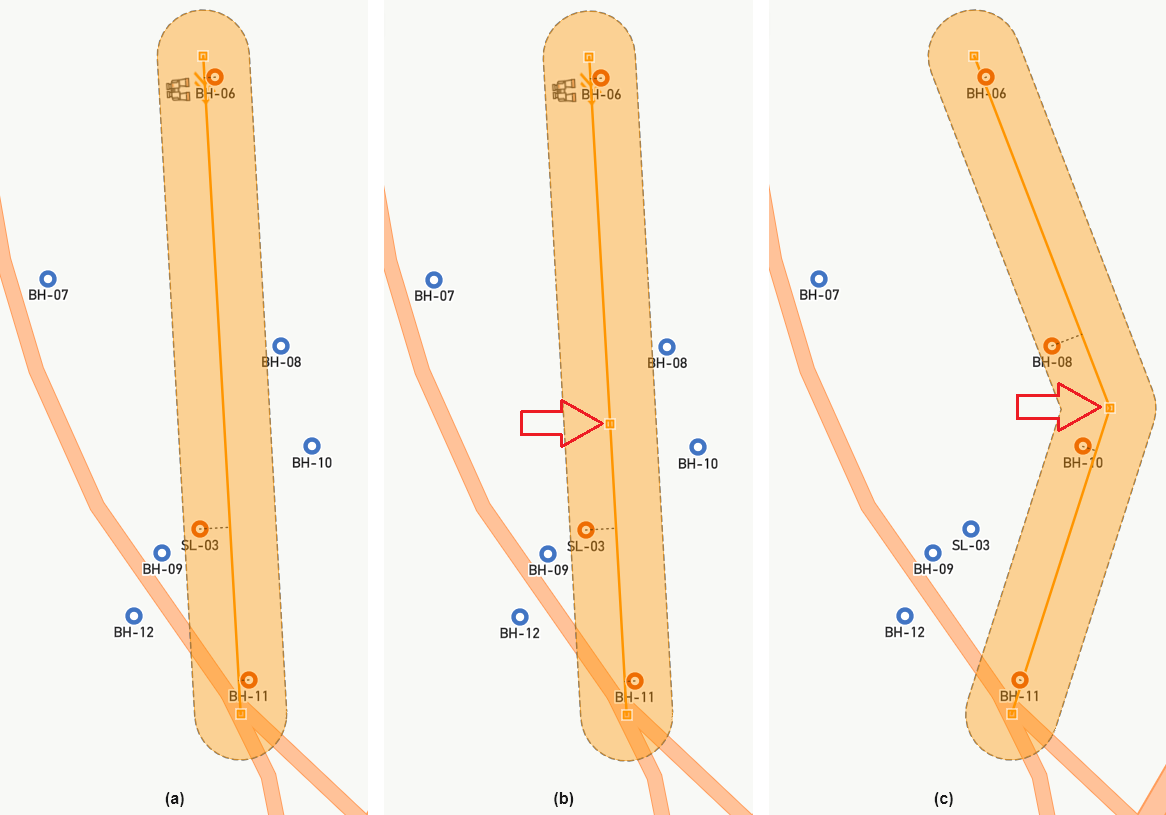
- Add a Point: to add a new point to the cross-section, click on the Add Profile Point button on the top-left portion of the map. Then click anywhere along the cross-section polyline to add the new point. Once the point is added, feel free to move it around to adjust the geometry of the cross-section.
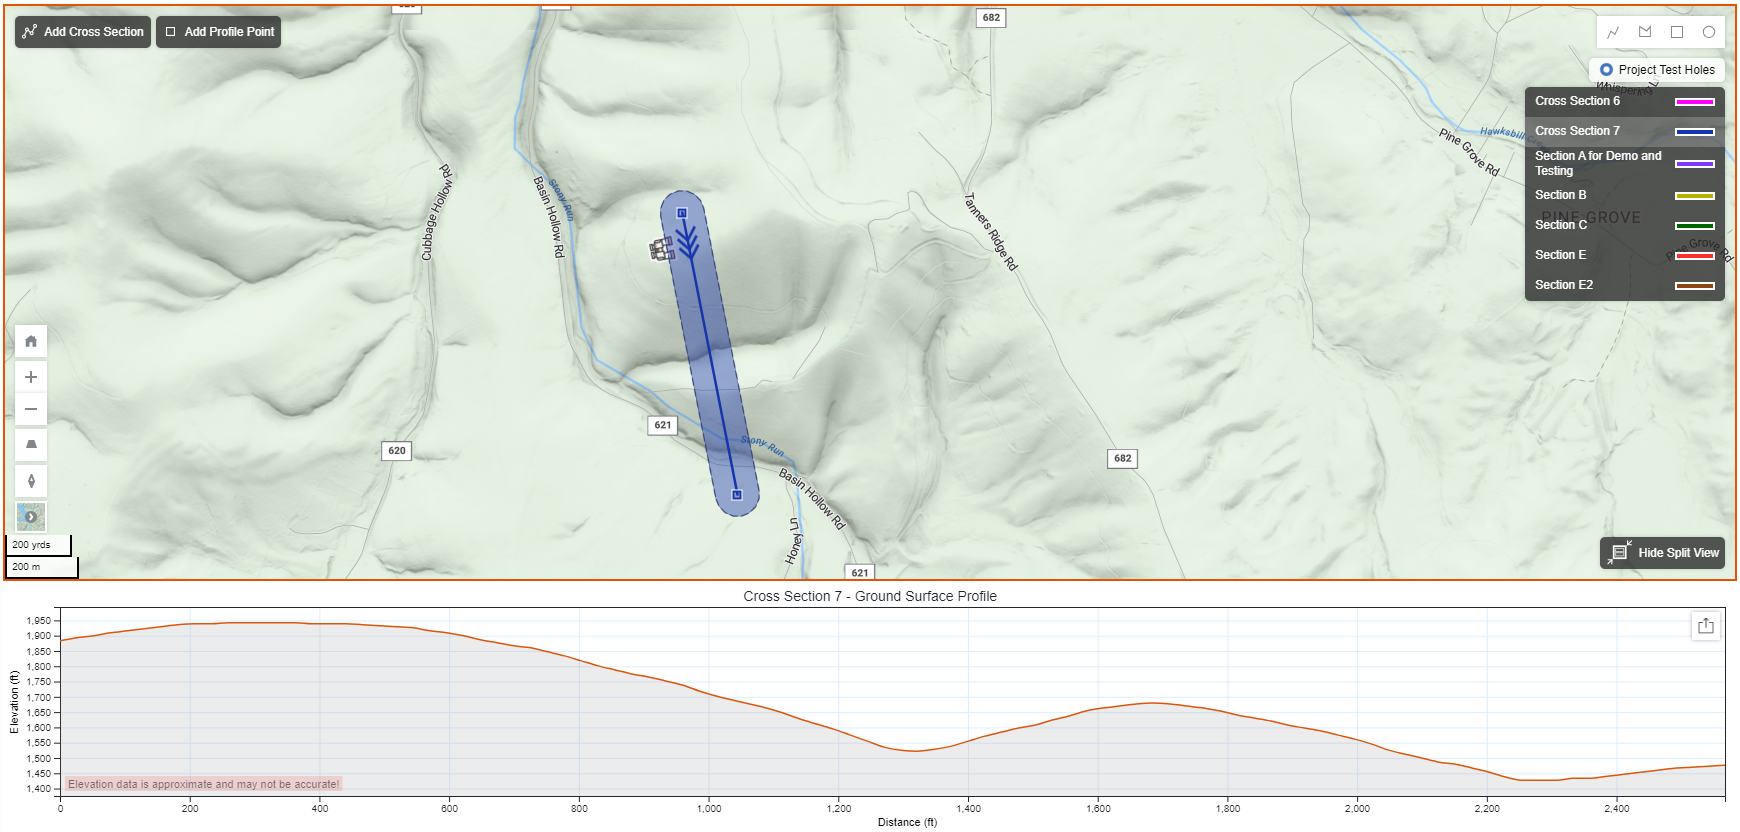
Ground Surface Profile
The estimated ground surface profile along the cross-section may be obtained from the map servers. In order to obtain the approximate ground surface profile:
- Click on the cross-section on screen to select it.
- From the Property Grid click on the Show Ground Surface Profile button.
- This will open a panel in the lower portion of the map to plot the ground surface along the cross-section.
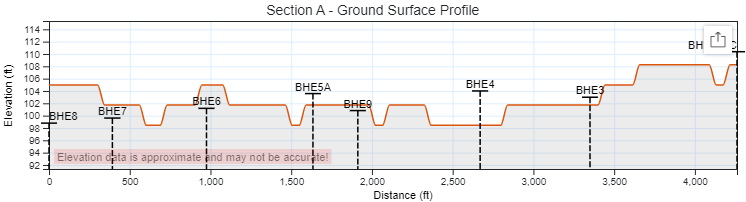
To save the ground surface profile to Image (PNG, SVG) or CSV format click on the export button at the top-right corner of the ground profile.
Historic Boreholes
If your project is located in the US, RSLog automatically searches for any Historic Boreholes within 5 miles of your project site. This data has been collected from various Departments of Transportation (courtesy of geosetta.org). The Historic Boreholes are shown on the map with  symbol. Click on a historic borehole to view its data in the Property Grid.
Virtual Boreholes
The Virtual Boreholes are generated by Artificial Intelligence (AI) based on over 500,000 historic boreholes collected from public projects in United States (courtesy of https://www.geosetta.org). To generate Virtual Boreholes:
- While in Plan Mode, click on Virtual Boreholes button from the top toolbar. This opens a new dialog,
- Select the plan layout of the boreholes from:
- Point: only one virtual borehole will be generated at the location specified by user,
- Polyline: 5 or 10 virtual boreholes will be generated along a polyline drawn by user, or
- Polygon: 10 or 20 virtual boreholes will be generated within a polygon drawn by user.
- Enter maximum prediction depth for the virtual boreholes.
- Agree with terms and conditions and click Generate button.
These boreholes are shown on the map with ★ markers. Click on a Virtual Borehole to view its data in the Property Grid.
The User understands these limitations and that Geosetta is a tool for planning subsurface investigations and not a substitute for it. In no event shall Geosetta or the Data Owners be liable to the User or another Party for any incidental, consequential, special, exemplary or indirect damages, lost business profits or lost data arising out of or in any way related to the use of information or data obtained from the Geosetta.org website.
Switch to Profile Mode
In plan view you can design the path of the cross-section polygon on the map. In order to edit the design of the cross-section (i.e. connecting strata) use one of the following methods:
- Using Context Menu: right-click on a cross-section from the map and select Open In Profile View menu.
- Using Property Grid: click to 'select' a cross-section. From its property grid (left) click on Switch to Profile View button.
Import / Export
Refer to this article for read about the import and export features in Cross-Section Designer.