Graph Liquefaction
Liquefaction graphs can be plotted at any Query Point location.
To use Graph Liquefaction:
- Right-click on the query and select Graph Liquefaction

- In the Plot Liquefaction dialog, select the stages you would like to plot (if your model has more than one stage), select OK, and the liquefaction plots will be generated.
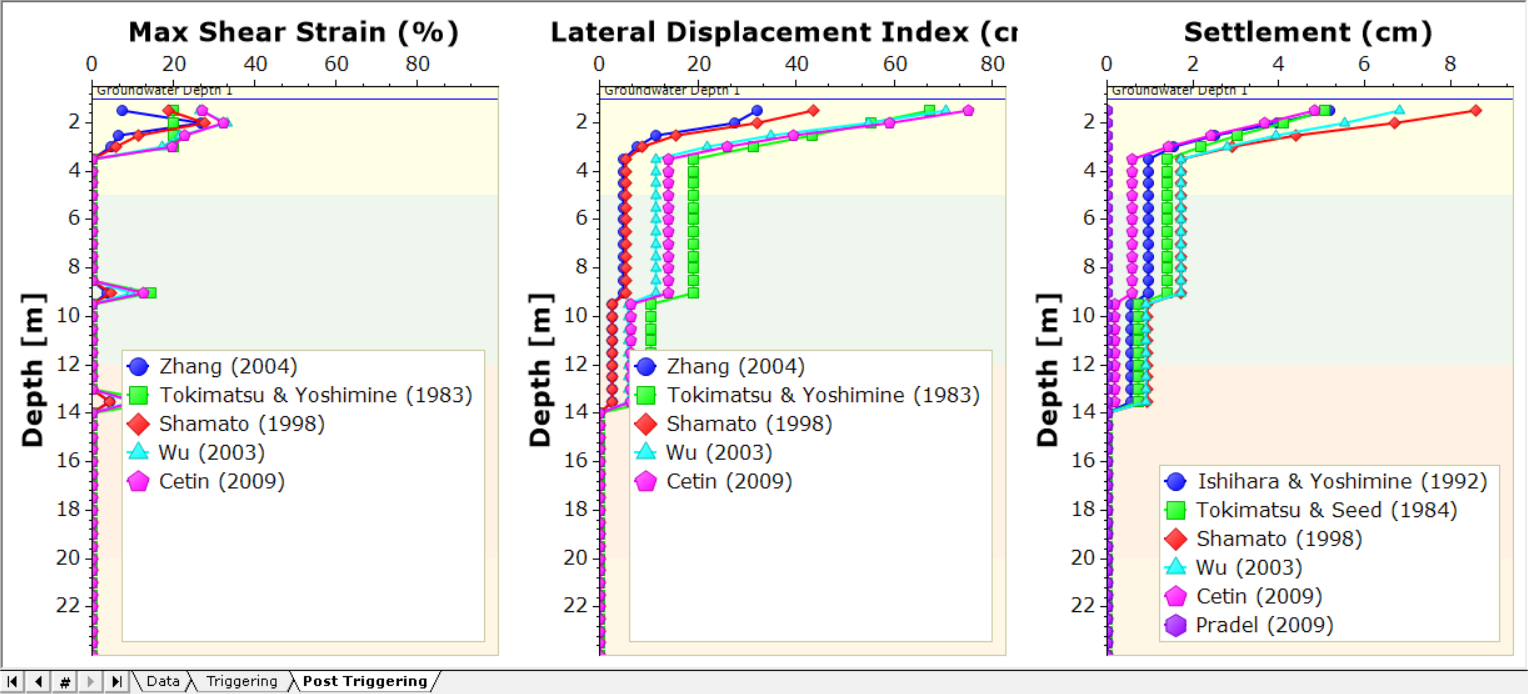
See the Liquefaction Results section for details on the liquefaction results.
Liquefaction analysis only allows users to enter data as depth below ground surface. If the project setting is set as elevation mode, the soil profile color will not appear on the graph and the results may not be consistent as the inputs are in depth mode while the soil profile is in elevation mode. For consistency of the results and visualization, we strongly encourage users to keep the same setting by selecting: Home > Project Settings > Soil Profiles and select 'Depth below Ground Surface' under the vertical axis setting.