Run Fragmentation Analysis
- Ensure that the suitable computation mode is active; i.e. Blast or Riprap (see General | Functionality and Features | Settings Pane topics).
- Optional – confine the fragmentation analysis to a specific area by drawing a mask. See description below.
- Run the fragmentation analysis by clicking the “Recalculate”
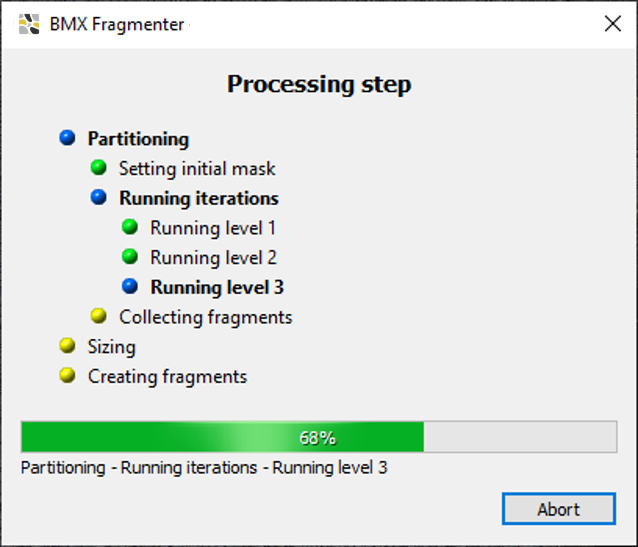
 button in the tool bar. The appearing dialog shows the current status of processing. The processing time depends on the size of the 3D model and the computational power. Results are displayed in the 3D viewer (colour overlay of detected fragments) and in the Plot pane (Particle Size Distribution Plot).
 - Adapt the results by using the features in the Settings pane. The 3D/2D viewers, the Particle Size Distribution Plot and the corresponding data in the Data pane are updated automatically
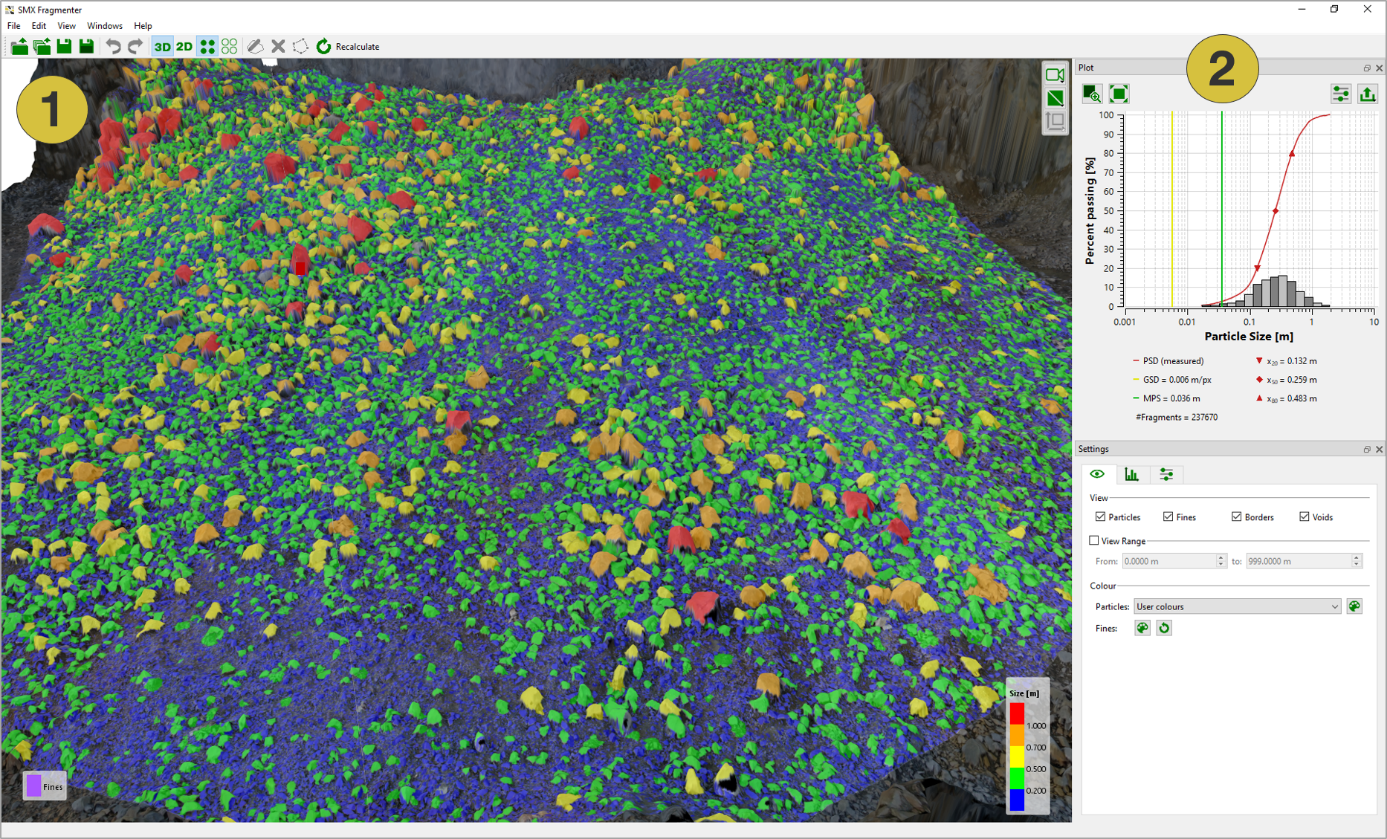
- 3D viewer with detected fragments
- Particle Size Distribution Plot
Analysis mask (optional)
The fragmentation analysis is limited to a specific area by drawing a mask (see below) by following procedure:
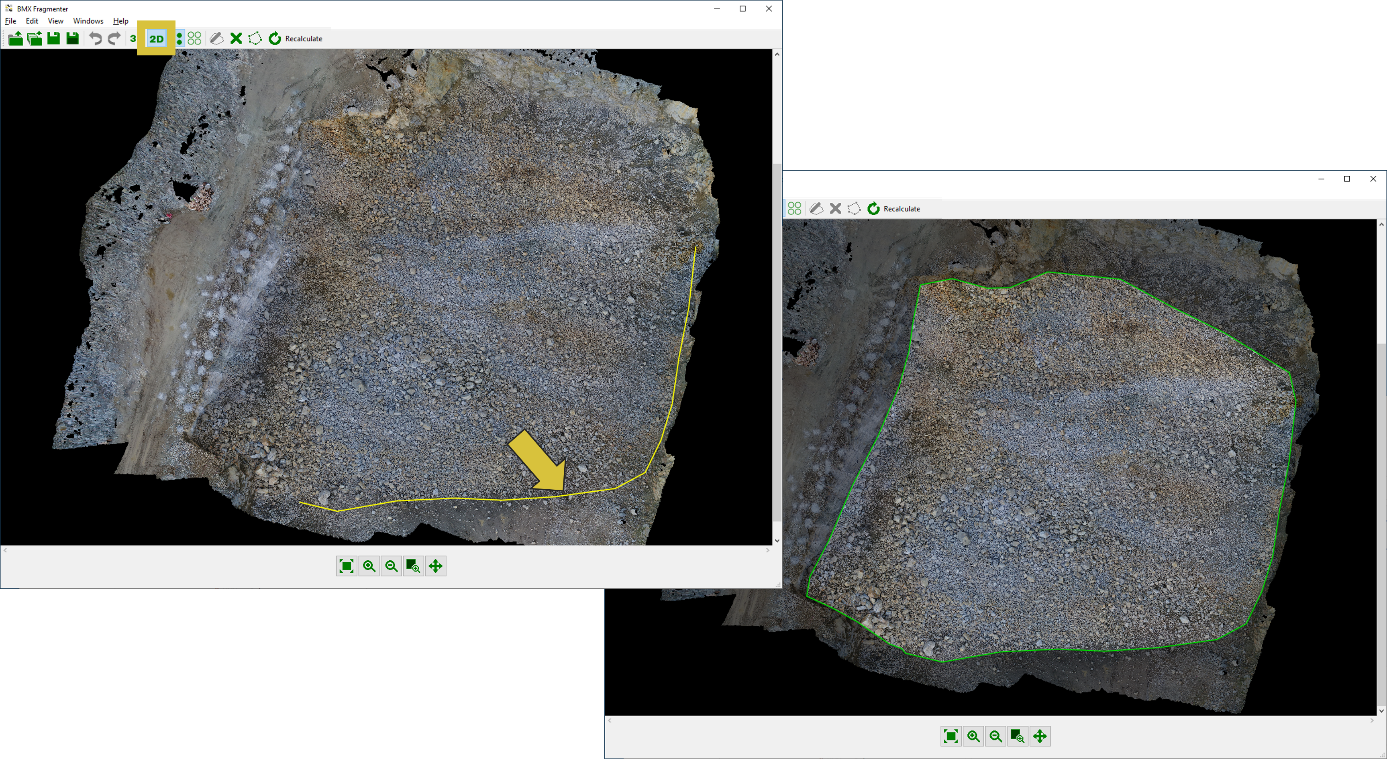
- Ensure that the 2D viewer is active
- Click the “Draw Mask”
 button in the toolbar
 - Mark the border line of the mask on the image by clicking the left mouse button. A polygonal yellow line grows instantaneously. Undo the last action by pressing the right mouse button (multiple uses possible).
- Confirm the polygon by pressing the “Enter” key or the middle mouse button
- Run the fragmentation analysis by clicking the “Recalculate” button in the tool bar
Drawing an analysis mask is supported in the 2D viewer only.
The mask (together with detected particles) is deleted by clicking the “Clear”  icon in the toolbar.
icon in the toolbar.