Plot Pane
The Plot pane shows the Particle Size Distribution (PSD) of the detected fragments by plotting the (cumulative) relative amount of particles (percent passing) according to the particle size. By default following parameters are given:
- Median Point Spacing (MPS) of the current 3D model
- Ground Sample Distance (GSD) in the images of the current 3D model
- x_20 reveals the diameter of particles for which 20 percent of the particles are finer and 80 particles are coarser
- x_50 reveals the diameter of particles for which 50 percent of the particles are finer and 50 particles are coarser
- x_80 reveals the diameter of particles for which 80 percent of the particles are finer and 20 particles are coarser
- # Fragments: Number of active fragments (Particles and Borders; see Settings Pane topic.)
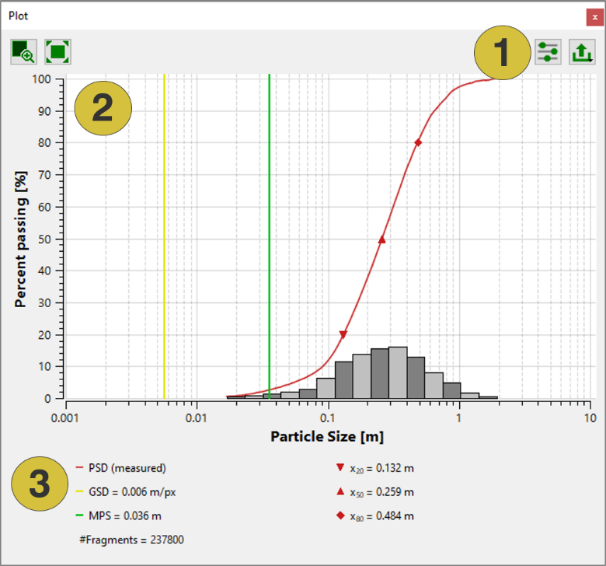
- Tool bar
- Particle Size Distribution Plot
- Info and results
Toolbar
- Zoom to Rectangle
 - Activates a zoom function. The plot is zoomed to the size of a rectangle drawn by holding the left mouse button pressed.
 - Reset View
 - Resets the view of the plot according to the configuration of the plot
 - Plot Configuration
 - Opens the Configuration dialog
 - Exports

- Save as Image - Saves the current image as “.jpg” file
- Copy Image to Clipboard - Copies the image to clipboard
- Export Plot as CSV - Exports the plot to a “.csv” file
- Export Plot as PDF - Export the plot to a “.pdf” file
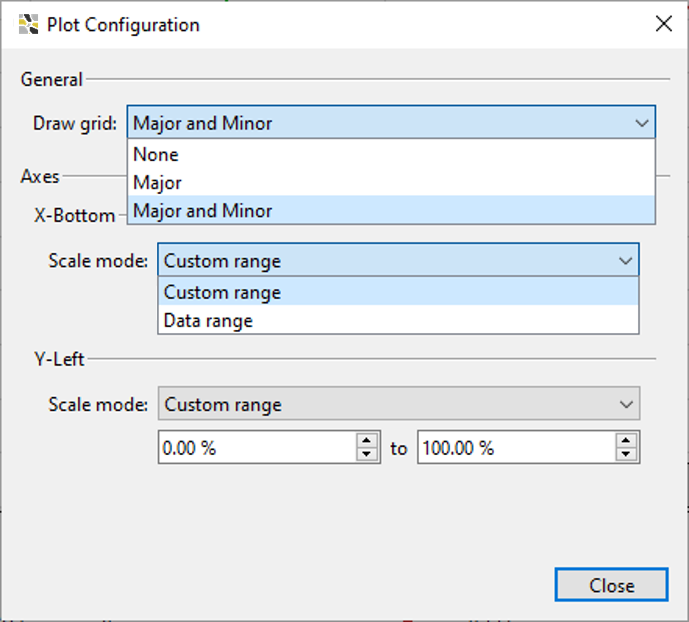
The Plot Configuration dialog is opened by clicking the “Plot Configuration” icon. The grid can be adapted by selecting “None”, “Major” and “Major and Minor” from the pull down menu General/Draw Grid. The axes can be adapted individually by selecting “Custom range” from the pull down menu and entering the desired range in the corresponding fields, X-Bottom (particle size) and Y-Left (percent passing).